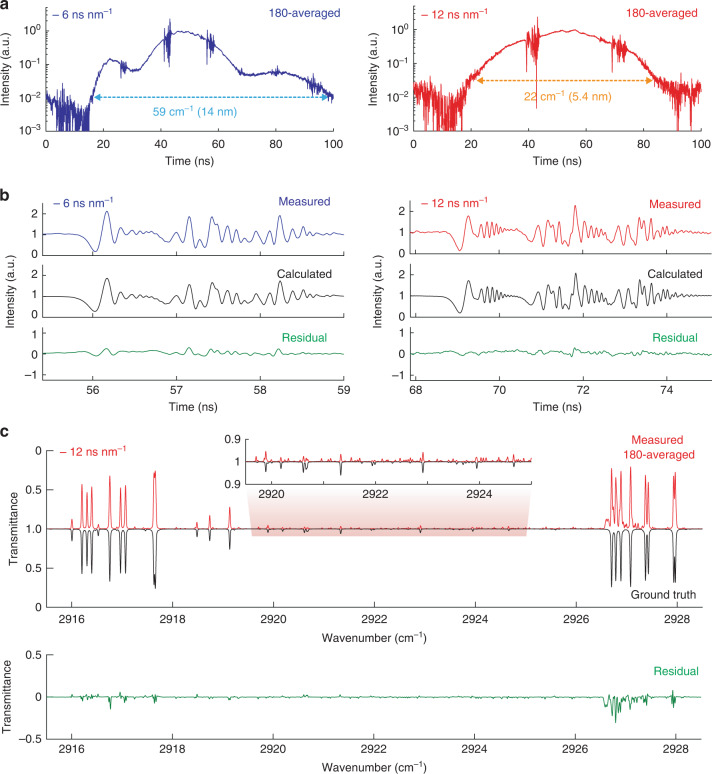
Fig. 4. High-resolution broadband TSIR spectra of CH4 molecules.
a 180-times averaged TSIR spectra measured with a 30-km DCF (dispersion of −6 ns nm−1) (blue) and a 60-km DCF (dispersion of −12 ns nm−1) (red). b Comparison between a part of measured and calculated TSIR spectra. The temporal baselines of the measured TSIR spectra are normalized by the envelope functions. The green plots represent the residuals. c A retrieved transmittance spectrum (dispersion of −12 ns nm−1) by the GD algorithm (red) compared to a calculated ground-truth transmittance spectrum from the HITRAN database (black). The inset shows a zoom-in view of small absorption peaks. The green plot shows residual

