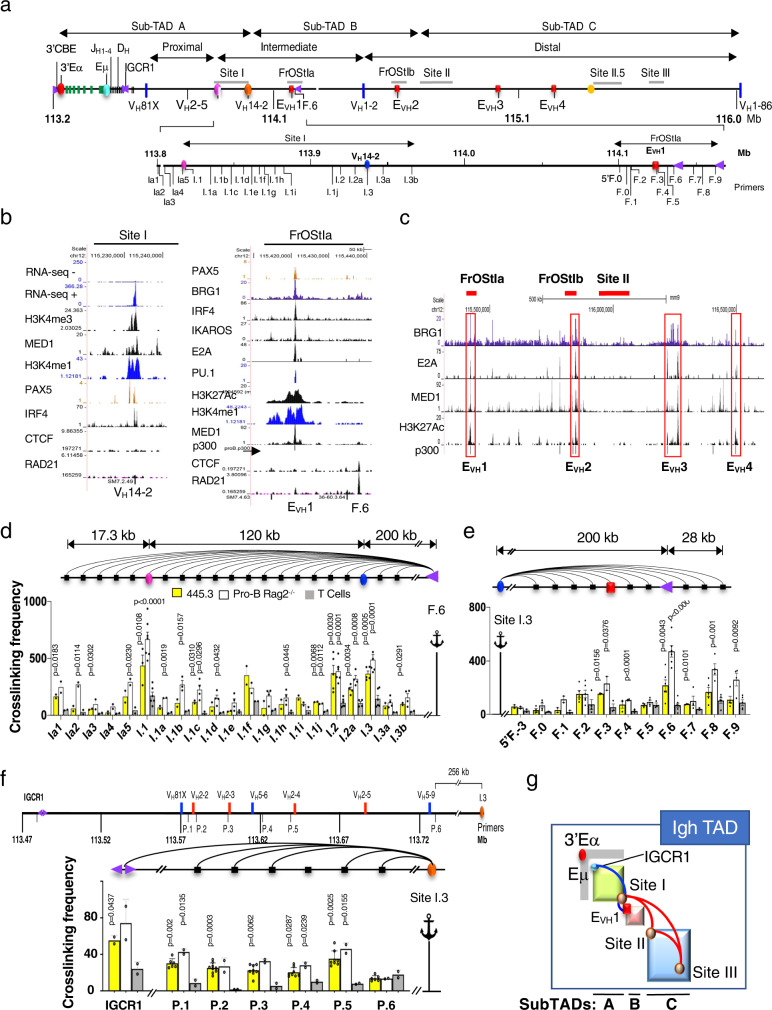
Fig. 1. Identification of Site I and FrOStIa loop anchors motifs.
a Schematic of the Igh locus with genomic coordinates (chr12, mm10) the directionality of which follows chromosome 12 showing the Igh sub-TADs A-C17 and DNA elements (3’Eα, red dot; CBEs, purple arrows with orientation indicated; Eγ, teal dot; Eµ, pink square; EVH1 (chr12:114182400-114183200), EVH2 (chr12:114609100-114609900), EVH3 (chr12:115023400-115024300), EVH4 (chr12:115257500-115258400), red squares; CH region genes, green bars; DH and JH exons, black bars; VH gene segments, blue bars. The 3C primer sites in Site I and FrOStIa are indicated at bottom. b Public Chip-seq and RNA-seq positive (+) and negative (-) strand analyses for VH14-2 and EVH1 and F.6 CBE were generated from Rag deficient pro-B cells (Supplementary Table 11). c ChIP-seq studies identify EVH1, EVH2, EVH3 and EVH4 (red rectangles). d–f 3C assays. Arcs (3C assays), primers are identified below the graphs, 3C probes (anchor symbol). Average crosslinking frequencies are from independent chromatin samples as indicated. Statistical comparisons are to T cells. P values from two-tail Student’s t test and SEMs. Source data are provided as a Source Data file. d 3C assays analyzing Site I anchored at F.6 CBE. Chromatin samples for Abl-t 445.3.11 line, n = 3; Rag2−/− pro-B cells, n = 3; T cells: n = 3. e 3C assays analyzing FrOStIa and anchored at Site I.3. Chromatin samples for Abl-t 445.3.11 line, n = 2; Rag2−/− pro-B cells, n = 2; T cells, n = 2. f (Upper panel) Schematic of subTAD A showing a subset of VH genes and 3C primers (P) with genomic coordinates (chr12, mm10). (Lower panel) 3C assays using the Site I.3 (I.3) anchor and P.1-P.6 primers. Chromatin samples for Abl-t 445.3.11 line, n = 6; Rag2−/− pro-B cells (n = 2); T cells (n = 2). g Schematic of the Igh locus with looping interactions between IGCR1:Site I (subTAD A; blue and orange dots), Site I:EVH1 (subTAD A-B; orange and red dots), and between Sites I:II, Sites II:III and Sites I:III (all subTADs; red arcs)17.

