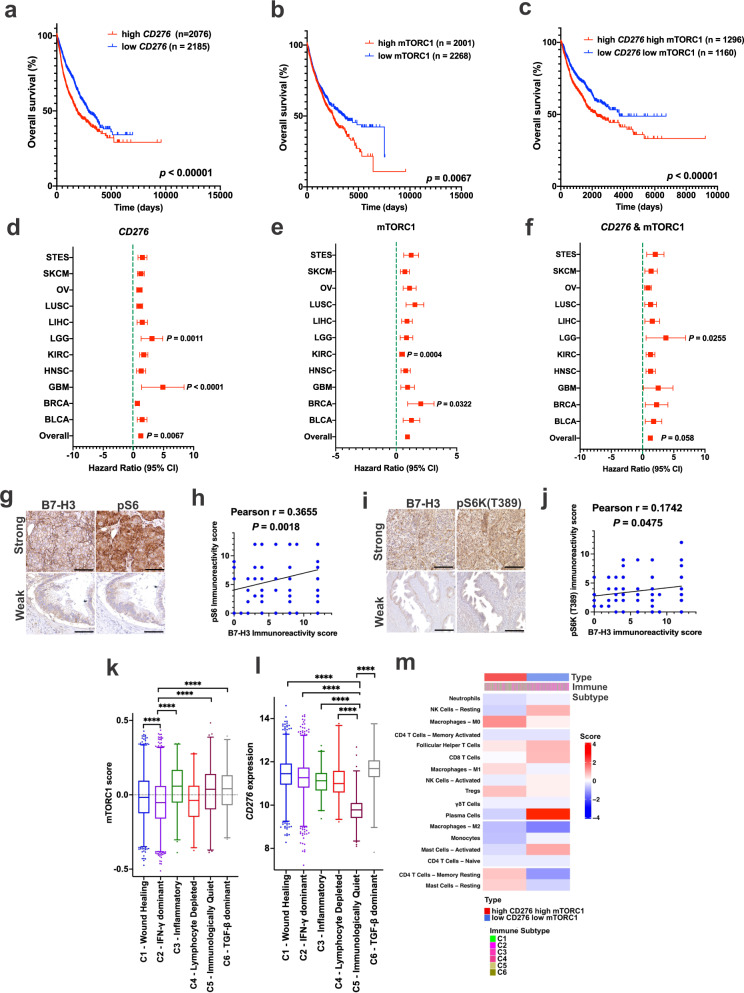
Fig. 1. Elevated mTORC1 activity and B7-H3/CD276 expression are associated with poorer clinical outcomes and immunosuppressive phenotypes.
Kaplan-Meier plot of overall patient survival stratified by high (n = 2076) and low (n = 2185) CD276 expression (a), high (n = 2001) and low (n = 2268) mTORC1 score (b), and high CD276 expression plus high mTORC1 score (n = 1296) and low CD276 expression plus low mTORC1 score (n = 1160) (c). Log-rank test. Forest plot of hazard ratios by tumor type and overall (with 95% confidence intervals) stratified by high and low CD276 expression (d), high and low mTORC1 score (e), and high and low CD276 expression plus high and low mTORC1 score (f). Hazard ratio greater than 1 (red) indicates an association with worse outcome. COX proportional hazards regression with Efron’s approximation. g, h Representative images of strong and weak immunohistochemical staining of phospho-S6 (Ser240/244) (pS6) and B7-H3 in tumor tissue microarrays, which include 12 cancer types: meningothelial meningioma, breast infiltrating ductal adenocarcinoma, colon adenocarcinoma, stomach adenocarcinoma, prostate adenocarcinoma, uterus adenocarcinoma, ovarian adenocarcinoma, esophageal squamous cell carcinomas, kidney clear cell carcinomas, hepatocellular carcinomas, lung adenocarcinoma/squamous cell carcinomas, and bladder transitional/papillary cell carcinomas. Scale bar = 50 μm (g). Correlation analysis between the phospho-S6 immunoreactivity score and B7-H3 expression score in the tumors in g (Pearson correlation coefficient test) (h). i, j Representative images of strong and weak immunohistochemical staining of phospho-S6K (Thr389) (pS6K) and B7-H3 in tumor tissue microarrays, which include 12 cancer types indicated in (g). Scale bar = 50 μm (i). Correlation analysis between the phospho-S6K immunoreactivity score and B7-H3 expression score in the tumors in i (Pearson correlation coefficient test) (j). mTORC1 score (k) and CD276 expression (l) among the six immune subtypes. Bars indicate median line, boxes denote interquartile range, whiskers denote 1–99 percentile and outliers are shown. Nonparametric Kruskal-Wallis test with Dunn’s multiple comparisons test. n = 5429, ****p < 0.0001. m Heatmap indicates mean scores of immune-cell of all patients in high CD276 and high mTORC1 tumors (left) and low CD276 - low mTORC1 tumors (right). Source data is provided in the Source data file.

