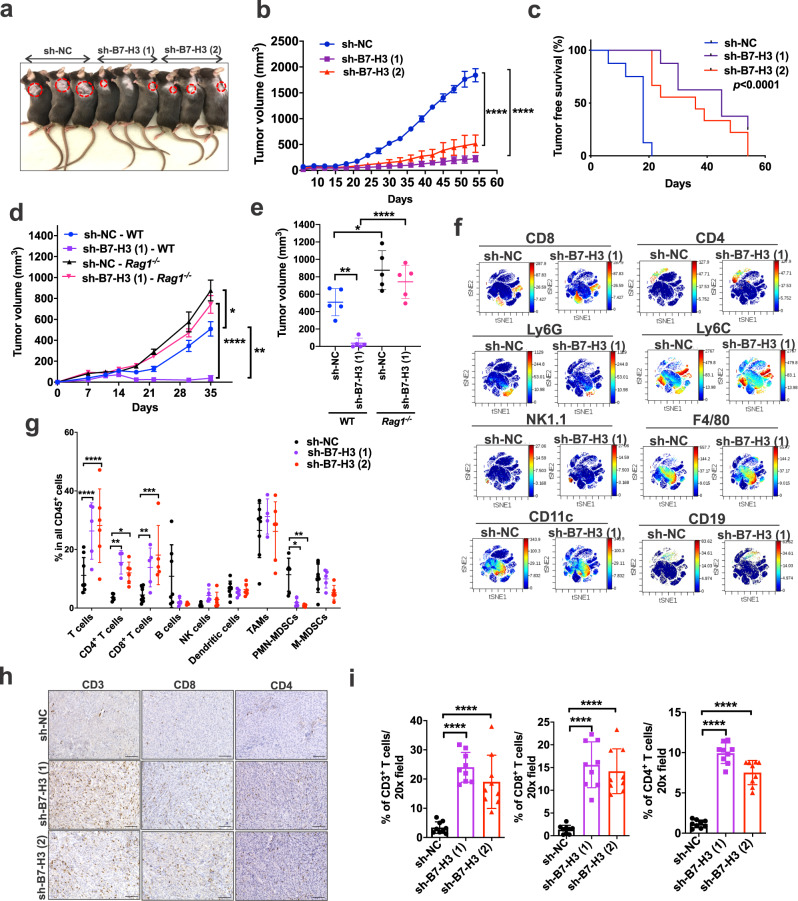
Fig. 5. Suppression of Tsc2-null tumor growth by inhibiting B7-H3 requires an intact adaptive immune system.
a Knockdown of B7-H3 using two different shRNAs in Tsc2−/− 105K cells inhibits subcutaneous tumor growth in syngeneic wild-type (WT) C57BL/6 J mice compared with non-targeting shRNA (sh-NC). b Growth of subcutaneous sh-NC, sh-B7-H3 (1), and sh-B7-H3 (2) Tsc2−/− 105K tumors in WT C57BL/6 J mice. n = 8 mice/group, means ± SD, one-way ANOVA with Holm-Sidak’s multiple comparisons test, ****p < 0.0001. c Tumor-free survival curve of mice in b. Log-rank analysis. d Growth of subcutaneous sh-NC or sh-B7-H3 (1) Tsc2−/− 105K tumors in WT or Rag1−/− C57BL/6 J mice. n = 5 mice/group, means ± SEM, two-way ANOVA with Holm-Sidak’s multiple comparisons test, *p < 0.05, **p < 0.01 ****p < 0.0001. e Tumor volume of d 35-day post cell inoculation. n = 5 mice/group, means ± SD, two-way ANOVA with Holm-Sidak’s multiple comparisons test, *p < 0.05, **p < 0.01 ****p < 0.0001. f Density viSNE plots from CyTOF data on pre-gated CD45+ tumor-infiltrating lymphocytes (TILs) from sh-NC or sh-B7-H3 (1) Tsc2−/− 105K tumors. g Percentage of indicated cell types within CD45+ TILs in f. n = 6 or 8 tumors for sh-NC group, n = 4 or 5 tumors for sh-B7-H3 (1), n = 4, 5, or 6 tumors for sh-B7-H3 (2). Exact n is indicated in Source data file. Means ± SD, two-way ANOVA with Holm-Sidak’s multiple comparisons test, *p < 0.05, **p < 0.01, ***p < 0.001, ****p < 0.0001. h Top panel: Representative images of CD3, CD4 and CD8 IHC staining on tumor sections from each group. Scale bar = 100 μm. i Quantification of CD3+, CD4+ and CD8+ T cells in each group (n = 9/group). Means ± SD, one-way ANOVA with Dunnett’s multiple comparisons test, ****p < 0.0001. Source data and exact p values are provided in the Source data file.

