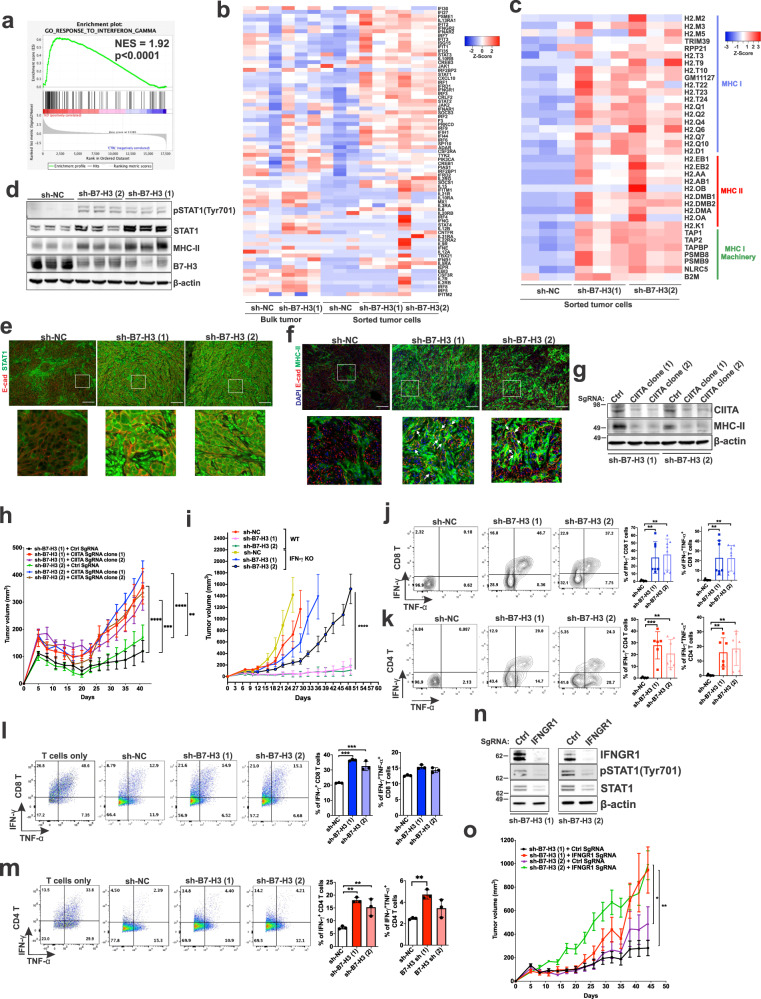
Fig. 6. Inhibition of B7-H3 increases expression of IFN-γ signature genes and MHC-II genes via enhancement of effector CD4+ and CD8+ T cell responses.
a IFN-γ is one of the top activated pathways in B7-H3 knockdown tumors versus control tumors (n = 3/group). NES = normalized enrichment score. b Heatmap of IFN-γ-induced gene expression in bulk tumors and sorted tumor cells of the indicated groups (n = 3/group). c Heatmap of unsupervised clustering of MHC-I/II gene expression in sorted tumor cells from each group (n = 3/group). d Immunoblot analysis of tumor lysates derived from the indicated tumors. (n = 3/group). e Representative images of E-cadherin (E-cad) and STAT1 immunofluorescent staining of tumor sections (n = 3/group). Scale bar = 100 μm. f Representative images of E-cad and MHC-II immunofluorescent staining on tumor sections (n = 3/group). White arrows indicate co-expression in the same cells. Scale bar = 100 μm. g Immunoblot analysis of Tsc2−/− 105K cells stably expressing sh-B7-H3 (1) or sh-B7-H3 (2) and control (Ctrl) or CIITA sgRNAs (n = 3). h CIITA knockout increases the subcutaneous growth of tumor cells in (g) in mice. n = 10 mice/group, means ± SEM, two-way ANOVA with Holm-Sidak’s multiple comparisons test, **p < 0.01, ***p < 0.001, ****p < 0.0001. i Growth of subcutaneous sh-NC, sh-B7-H3 (1), or sh-B7-H3 (2) Tsc2−/− 105K tumors in strain-matched WT or IFN-γ KO mice. n = 10 mice/group, means ± SD, Mann-Whitney U Test, ****p < 0.0001. Percentage of IFN-γ/TNF-α positive tumor-infiltrating CD8+ (j) and CD4+ (k) T cells in the indicated tumors. n = 6, 7 or 8/group. Exact n is indicated in Source data file. Means ± SD, one-way ANOVA with Dunnett’s multiple comparisons test, **p < 0.01, ***p < 0.001. Percentage of IFN-γ/TNF-α in WT splenic CD8+ (l) and CD4+ (m) T cells after co-culture with Tsc2−/− control, B7-H3 (1) or B7-H3 (2) shRNA 105K cells. n = 3, means ± SD, one-way ANOVA with Dunnett’s multiple comparisons test, **p < 0.01, ***p < 0.001. n Immunoblot analysis of Tsc2−/− 105K cells stably expressing B7-H3 (1) or B7-H3 (2) shRNA and control (Ctrl) or IFNGR1 sgRNAs (n = 3). o IFNGR1 knockout increases the subcutaneous growth of tumor cells in (n) in mice. n = 10 mice/group, means ± SEM, two-way ANOVA with Holm-Sidak’s multiple comparisons test, *p < 0.05, **p < 0.01. Source data and exact p values are provided in the Source data file.

