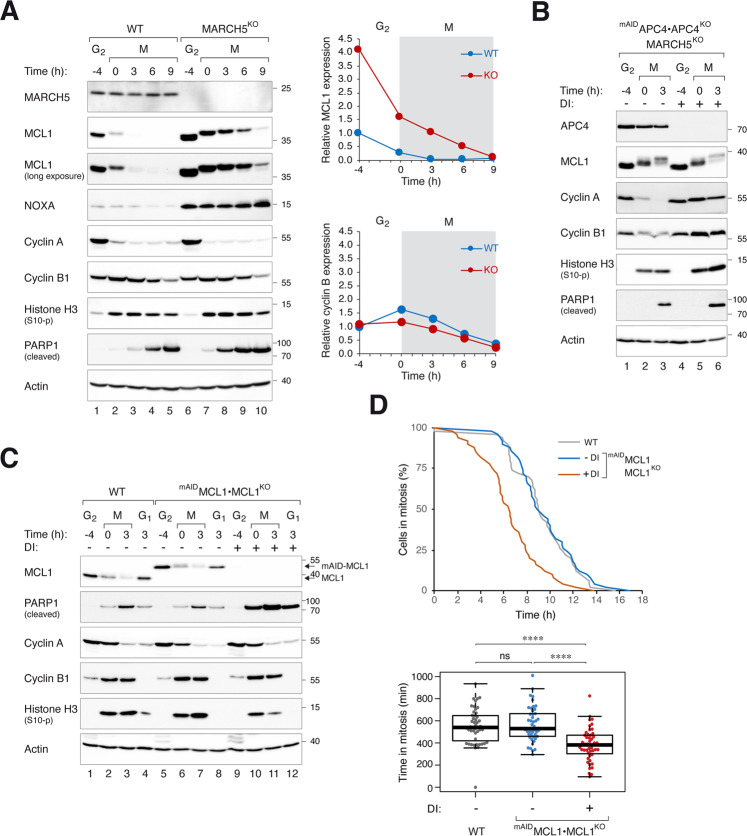
Fig. 2. MARCH5 determines MCL1 expression at mitotic entry.
A KO of MARCH5 elevates MCL1 during mitotic arrest. Parental HeLa (WT) and MARCH5KO cells were synchronized and arrested in mitosis as before. Protein expression was analyzed with immunoblotting. Different exposures of the MCL1 blot are shown to provide a better comparison of the degradation kinetics. The MCL1 and cyclin B1 bands were quantified and shown in the right-hand panels (normalized to G2 expression in HeLa cells). B Mitotic degradation of MCL1 is independent on MARCH5 and APC/C. APC4KO expressing mAIDAPC4 were generated in a MARCH5KO background. The cells were synchronized and arrested in mitosis as before. DI were applied to turn off the expression of mAIDAPC4 at the time of second thymidine release. Lysates were prepared and analyzed with immunoblotting. C Mitotic apoptosis is negatively regulated by MCL1. HeLa and MCL1KO expressing mAIDMCL1 were synchronized and arrested in mitosis as before. mAIDMCL1 was turned off with DI at the time of second thymidine release. Protein expression was analyzed with immunoblotting. D Accelerated mitotic apoptosis in the absence of MCL1. HeLa and MCL1KO expressing mAIDMCL1 were transiently transfected with histone H2B-GFP before synchronized and arrested in mitosis as before. The cells were either untreated or incubated with DI at the time of second thymidine release. Individual cells were tracked using live-cell imaging for 24 h (starting at 8 h after second thymidine release) (n = 50). The duration of mitotic arrest is plotted using Kaplan–Meier estimator. Box-and-whisker plots show the elapsed time between mitotic entry and mitotic apoptosis/slippage. ****p < 0.0001. The raw data for individual cells are shown in Fig. S6.

