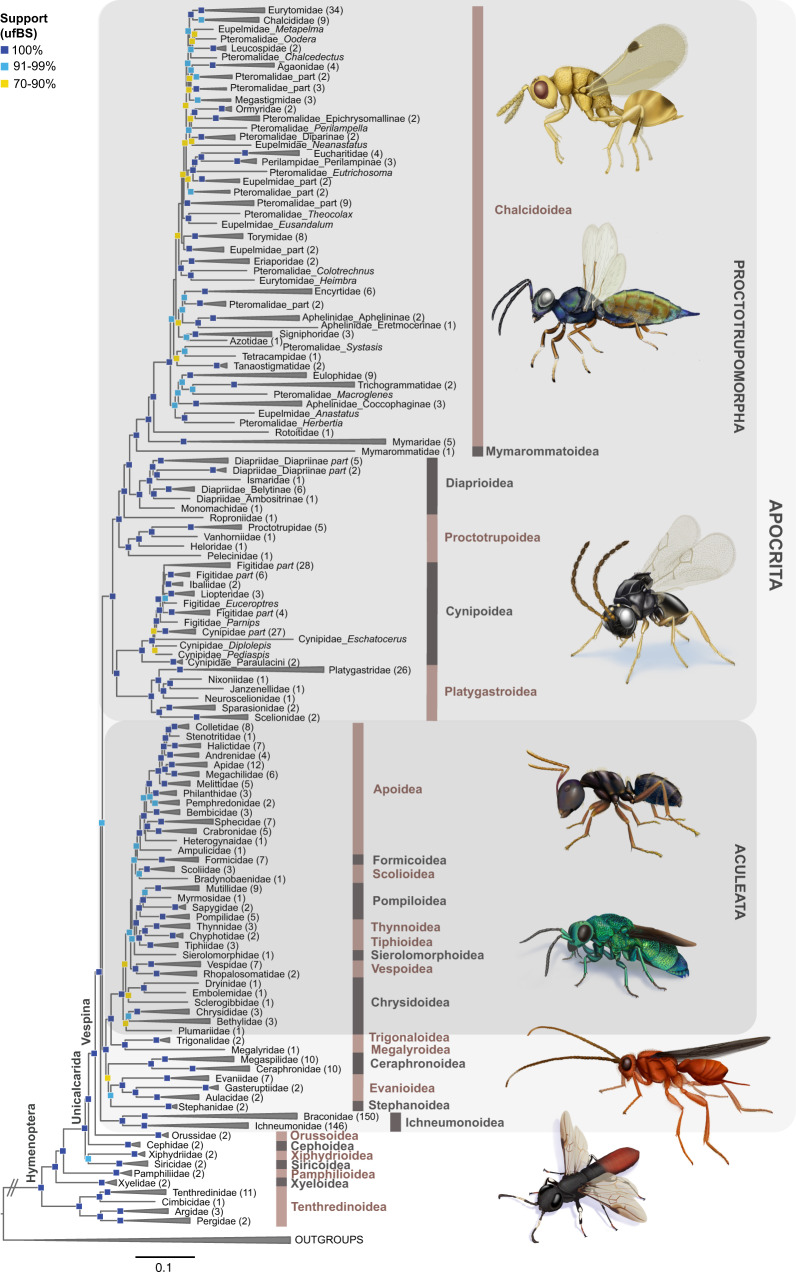
Fig. 1. Family-level phylogeny of Hymenoptera.
Phylogeny shows relationships between hymenopteran families as estimated from 446 UCE loci in the nuc-70%-SWSC analysis. This data set was partitioned using the Sliding-Window Site Characteristics Entropy (SWSC-EN) algorithm106 and PartitionFinder2107 in combination with the r cluster algorithm108 and analyzed using Maximum Likelihood (ML) best-tree and ultrafast bootstrap searches in IQ-TREE v1.6.10109. This result is referred to as topology C-1 (topC-1) throughout the text and the remaining figures and tables. Various nodes have been collapsed for clarity of display, with numbers of species subtended by the respective branches included in brackets. Ultrafast bootstrap (ufBS) support values are indicated by colored squares on respective nodes: dark blue = 100%, light blue = 91–99%, and yellow = 70–90%. Support values lower than ufBS = 70 are not shown. Scalebar represents substitutions/bp. Source data for this figure can be found in the Dryad repository at 10.5061/dryad.08kprr54m (folder 2.1.7).

