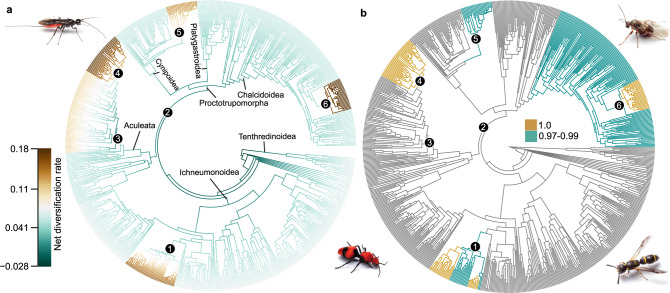
Fig. 3. Diversification history of Hymenoptera.
We assessed potential shifts in diversification rates over time in Hymenoptera using a sampling fraction approach and clade-specific sampling probabilities in BAMM v2.545,46 and the associated R package BAMMtools v2.1.7115. All analyses shown are based on topology C-1. a Plot of best shift configuration with maximum a posteriori probability (MAP), indicating rate shifts on respective branches. Rates are shown as net diversification rates. Since this rate shift configuration only has a 0.019 probability among 9910 distinct shift configurations in the 95% credibility set, we summarized the cumulative probabilities for each branch that a shift occurred somewhere between the focal branch and the root of the tree. b Cumulative shift probability tree, indicating in dark cyan the branches with a shift probability ≥0.97 ≤ 0.99 and in gold the branches with a cumulative shift probability = 1. Golden branches thus occur in every distinct shift configuration and cyan branches in 97–99% of all distinct shift configurations. Numbered clades/shifts are (1) Ichneumonidae (internal); (2) Apocrita minus Ichneumonoidea; (3) Aculeata minus Chrysidoidea; (4) Bees minus Melittidae; (5) Cynipidae s.s.; (6) Eurytomidae (Eurytominae). For detailed information on methodology and results, refer to the main text, Supplementary Methods, and Supplementary Data 9 and 16. Images of wasps courtesy of Matt Bertone. Source data for this figure can be found in the Dryad repository at 10.5061/dryad.08kprr54m (folder 3.2).

