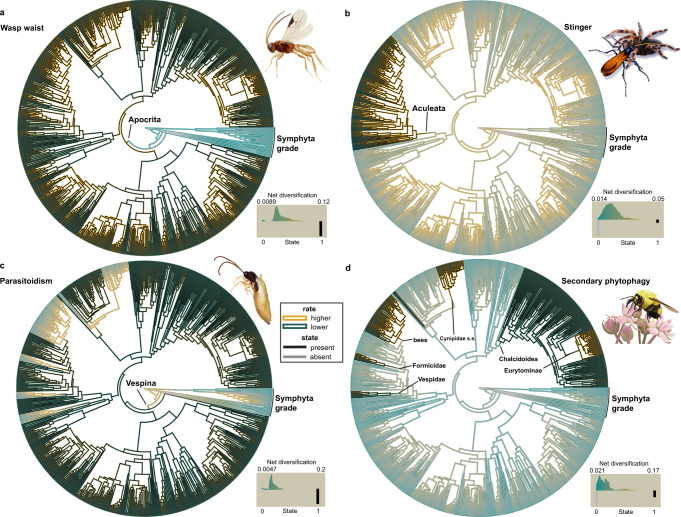
Fig. 4. Trait-dependent diversification analyses.
We tested 30 models of trait-dependent and trait-independent diversification in the HiSSE framework48 for the four putative key innovations and plotted net diversification rates and state reconstructions from the best-fitting model onto the Hymenoptera phylogeny. All results shown were based on topology C-1. Inner branch colors represent the presence/absence of the respective states (black = presence; gray = absence); outer branch colors represent the net diversification rate (highest = gold, lowest = dark cyan). Clades discussed in the context of the results are labeled. The histograms in the lower right of each panel represent the distribution of net diversification rates associated with the observed states (0 = absent, 1 = present). a Wasp waist, model: HiSSE—full, irreversible states; b Stinger, model: CID-4−9 distinct transition rates; c Parasitoidism, model: HiSSE—full, all free parameters; d Secondary phytophagy, model: HiSSE—full, irreversible states. Best-fitting models for the wasp waist (a), parasitoidism (c), and secondary phytophagy (d) are trait-dependent models that suggest the association of a hidden state with the analyzed traits influencing diversification in Hymenoptera. The best-fitting model for the stinger (b) is a trait-independent model. For detailed information on methodology, results, and model scores, refer to the main text, Supplementary Methods, and Supplementary Data 10–12 and 16–17. Source data for this figure can be found in the Dryad repository at 10.5061/dryad.08kprr54m (folder 3.3).

