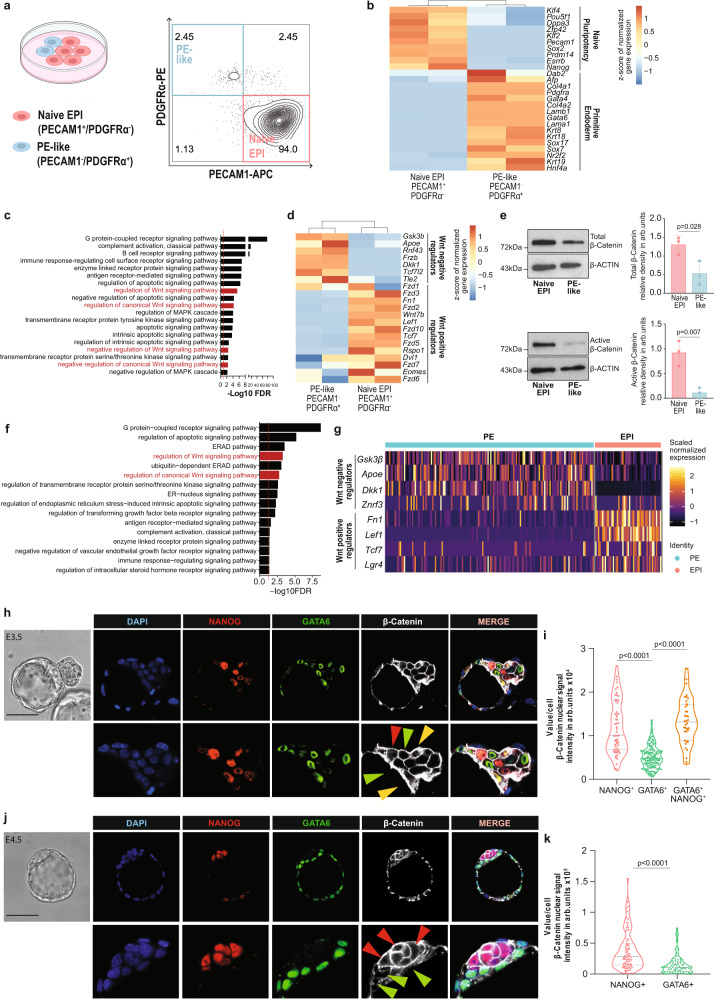
Fig. 1. EPI and PE populations show differential Wnt pathway activity in vitro and in embryos.
a (Left) Schematic representation of mESCs heterogeneity. Created with BioRender.com. (Right) Flow cytometry density plot of mESC populations co-stained for PECAM1 and PDGFRα. b Expression of EPI and PE specific markers by PECAM1+ and PDGFRα + sorted cell populations, respectively. Unsupervised clustering. n = 2 independent samples per condition13. c GO enrichment analysis of DEGs between naive EPI and PE-like sorted cell populations13. Red dashed line=FDR 0.05. d Expression of Wnt positive and negative regulators in naive EPI and PE-like sorted cell populations. Unsupervised clustering. n = 2 independent samples per condition13. e (Left) Representative images and (right) quantification of total/active β-Catenin levels in naive EPI and PE-like sorted cell populations. Mean ± SD; n = 3 biologically independent samples; two-tailed unpaired t test. f GO enrichment analysis of DEGs between EPI and PE cells in E4.5 embryos from50. Red dashed line = FDR 0.05. g Expression of Wnt positive and negative regulators in EPI and PE lineages in E4.5 embryos50. h Representative immunofluorescence (IF) image of active β-Catenin signal in E3.5 embryo. EPI-NANOG+ cells (red arrow), PE-GATA6+ cells (green arrow) and double-positive NANOG+/GATA6+ cells (yellow arrow). Scale bar=50 μM. Zoomed region of interest is reported below the images. i Nuclear active β-Catenin signal in EPI-NANOG+, PE-GATA6+ and double-positive NANOG+/GATA6+ cells. Integrated intensity in arbitrary units (arb. units). NANOG+ n = 38, GATA6+ n = 111 and NANOG+/GATA6+ n = 58 cells; 2 independent experiments; one-way ANOVA test. j Representative IF image of active β-Catenin signal in freshly isolated E4.5 embryo. EPI-NANOG+ cells (red arrow), PE-GATA6+ cells (green arrow). Scale bar = 50 μM. Zoomed region of interest is reported below the images. k Nuclear active β-Catenin signal in EPI-NANOG+ and PE-GATA6+ cells. Integrated intensity in arbitrary units (arb. units). NANOG+ n = 78; GATA6+ n = 68 cells; 2 independent experiments; two-tailed unpaired t test. Source data for all experiments are provided as a Source data file.

