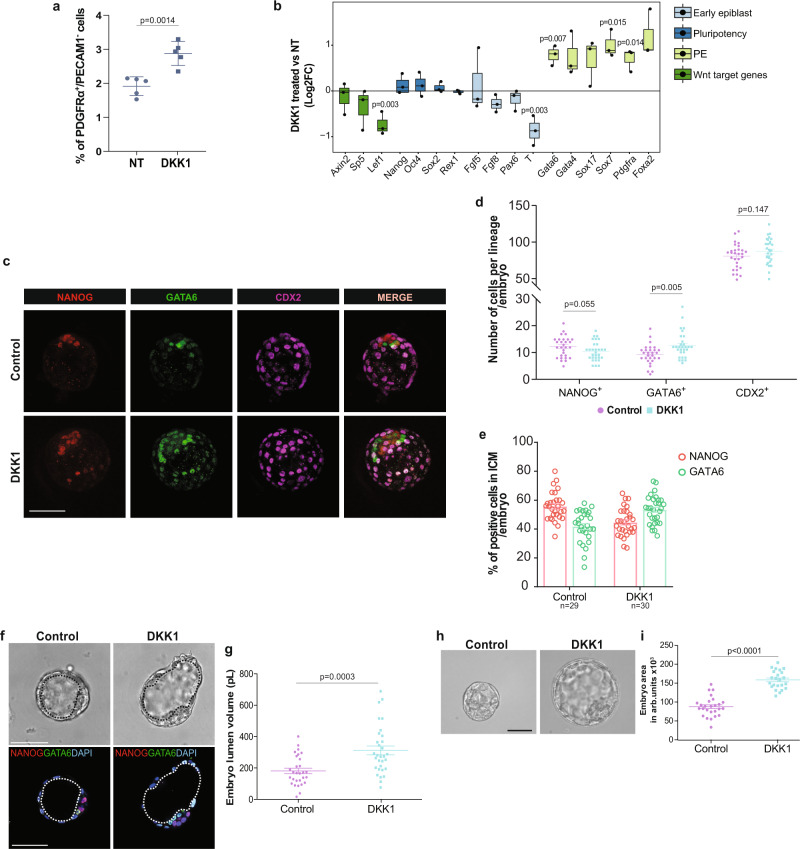
Fig. 2. Wnt signaling inhibition promotes a shift towards the PE fate.
a Percentage of PE-like cells (PDGFRα+/PECAM1-) in control and DKK1-treated mESCs. Mean ± SD; n = 5 independent experiments, two-tailed unpaired t test. b Gene expression analysis of early EPI, pluripotency, PE and Wnt target genes on control and DKK1-treated mESCs. Horizontal line denotes the median value, box refers to the 25th to 75th percentiles and whiskers mark min and max values. n = 3 independent experiments; two-tailed unpaired t test. c Representative IF image of NANOG, GATA6 and CDX2 protein signals in E2.5 + 48H control and DKK1 treated embryo. Scale bar = 50 μM. d Number of NANOG+,GATA6+ and CDX2+ cells (counts) per embryo. Mean ± SEM; Control: n = 29; DKK1 n = 30; 3 independent experiments; multiple unpaired t tests with Holm-Sidak method. e Percentage of NANOG+ and GATA6+ cells normalized on total number of ICM per embryo. Mean ± SEM; Ctrl n = 29, DKK1 n = 30; 3 independent experiments. f Representative BF and IF image of E2.5 + 48H control and DKK1 treated embryo. Black and white dotted lines delimitate blastocyst cavity (lumen). Scale bar = 50 μM. g Embryo lumen volume reported in pico liters (pL). Μean ± SEM; Ctrl n = 29, DKK1 n = 31; 3 independent experiments. two-tailed unpaired t test. h Representative brightfield (BF) image of embryo morphology. Scale bar = 50 μM. i Embryo total area reported in arb. units Μean ± SEM; Ctrl n = 26, DKK1 n = 23; 3 independent experiments, two-tailed unpaired t test. Source data for all experiments are provided as a Source data file.

