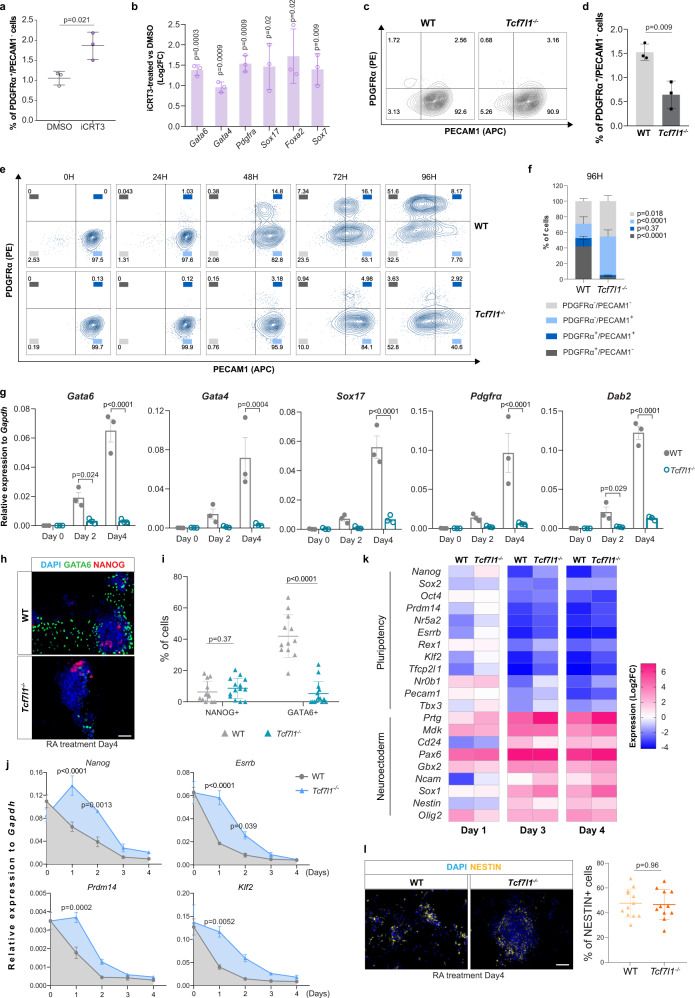
Fig. 3. Tcf7l1 deletion impairs PE transition without preventing pluripotency exit and neuroectodermal differentiation.
a Percentage of PDGFRα+/PECAM1- cells in mESC cultured with iCRT3. Mean ± SD; n = 3 independent experiments; two-tailed unpaired t test. b qRT-PCR of PE markers in mESCs cultured with iCRT3. Values represent Log2 of fold change expression relative to DMSO. Log2FC ± SD; n = 3 independent experiments; multiple unpaired t tests with Holm-Sidak method. c Representative flow cytometry plots of WT and Tcf7l1−/− cells co-stained for PECAM1 and PDGFRα. d Percentage of PDGFRα+/PECAM1- cells in WT and Tcf7l1−/− mESCs. Mean ± SD; n = 3 biologically independent samples; two-tailed unpaired t test. e Representative flow cytometric plots of WT and Tcf7l1−/− cells co-stained for PECAM1 and PDGFRα markers upon RA treatment. n = 3 independent experiments. f Flow cytometry analysis of PDGFRα and PECAM1 populations at 96H of RA treatment. Mean ± SD; n = 3 independent experiments; two-way ANOVA test. g qRT-PCR of PE markers in WT and Tcf7l1−/− mESCs upon RA treatment. Mean ± SEM; n = 3; two-way ANOVA test. h Representative IF image of GATA6 and NANOG in WT and Tcf7l1−/− mESCs upon RA treatment. Scale bar = 50 μm. i Quantification of NANOG+ and GATA6+ cells of Fig. 3h. Mean ± SD; two-tailed unpaired t test. Each dot represents % of cells in a field of view; WT:n = 12 non-overlapping images, Tcf7l1−/−: n = 14 non-overlapping images from n = 1 experiment. j qRT-PCR of pluripotency markers in WT and Tcf7l1−/− mESCs upon RA treatment. Mean ± SEM; n = 3 independent experiments; two-way ANOVA test. k qRT-PCR of embryonic neuroectodermal markers in WT and Tcf7l1−/− mESCs upon RA treatment. Gene expression values are reported as Log2 of fold change expression. n = 3 independent experiments. l (Left) Representative IF image of NESTIN in WT and Tcf7l1−/− mESCs upon RA treatment. (Right) Quantification of NESTIN+ cells. Mean ± SD; two-tailed unpaired t test. Each dot represents % of cells in a field of view; WT: n = 12 non-overlapping images, Tcf7l1−/−: n = 11 non-overlapping images from n = 1 experiment. Source data for all experiments are provided as a Source data file.

