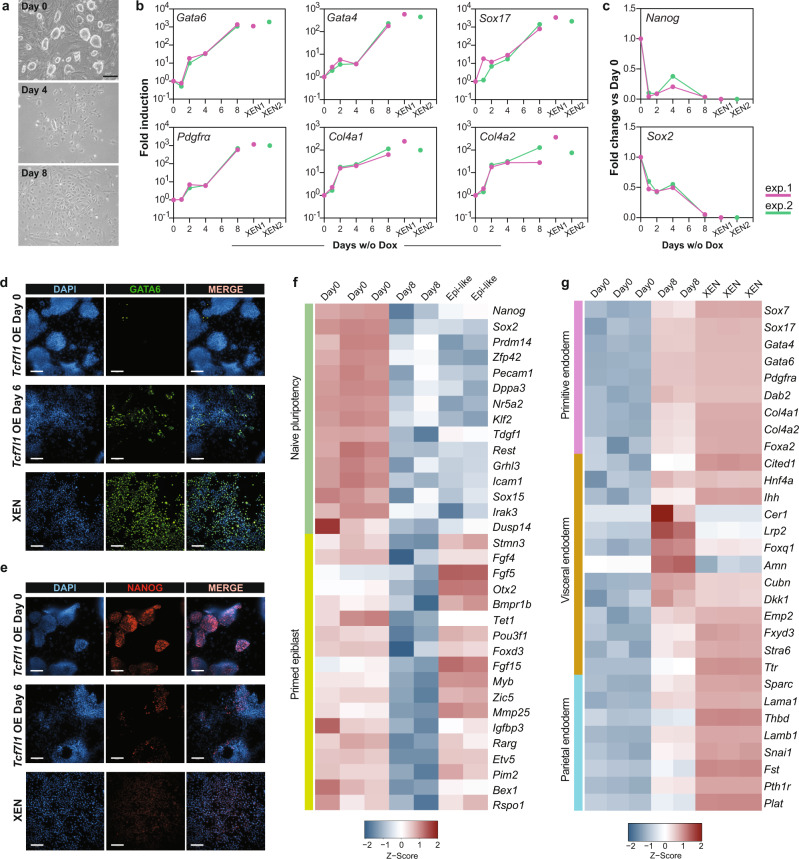
Fig. 4. Tcf7l1 expression is sufficient to drive PE cell fate specification.
a Representative BF images of Tcf7l1-OE-mESCs cultured with Dox (D0) or without Dox (D4 and D8) from 3 independent experiments. Scale bar = 50 μm. b qRT-PCR of PE markers at indicated time points of Tcf7l1 OE from 2 independent experiments (pink and green lines). Expression levels of each gene is shown for XEN cells from the corresponding experiment (pink and green dots). All values are reported as fold change relative to Day0. The x-axis reports log10 scale. n = 2 independent experiments, see Source data file. c qRT-PCR of pluripotency markers at indicated time points of Tcf7l1 OE from 2 independent experiments (pink and green lines). Expression levels of each gene is shown for XEN cells from the corresponding experiment (pink and green dots). All values are reported as fold change relative to Day0. n = 2 independent experiments, see Source data file. d Representative IF image of GATA6 in Tcf7l1-OE-mESCs after 0 and 6 days of induction and XEN cells from 3 independent experiments. Scale bar = 100 μM. e Representative IF of NANOG as in Fig. 4d. f Normalized gene counts heatmap showing expression of naive pluripotency and primed epiblast markers in mESCs (D0), after 8 days of Tcf7l1 induction (D8) and in Epi-like cells. g Normalized gene counts heatmap showing expression of primitive endoderm, visceral and parietal endoderm markers in mESCs (D0), after 8 days of Tcf7l1 induction (D8) and XEN cells. Source data are provided in the Source data file.

