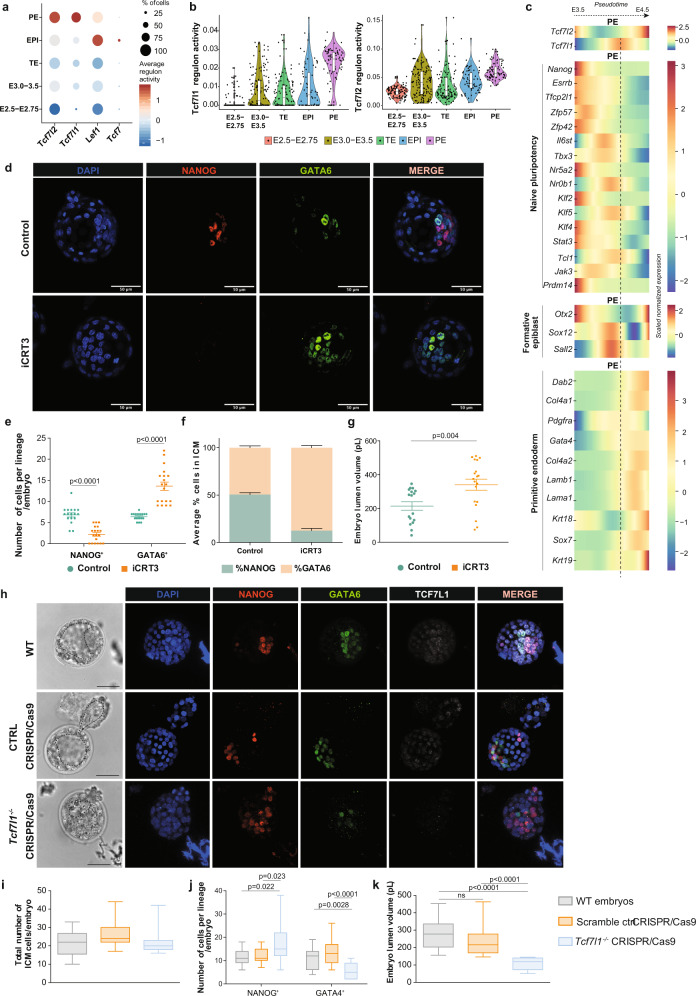
Fig. 6. Tcf7l1 is required for PE lineage formation in embryos.
a Regulon activity analysis of TCF/LEF factors during embryo preimplantation development82. Circle size indicates % of cells in which TCF/LEF regulons are active. b Violin plot depicting Tcf7l1 and Tcf7l2 regulon activity at different developmental stages of embryo development82. Dots represent individual cells (n). E2.5-E2.75: n = 114, E3.0-E3.5: n = 146, TE: n = 115, EPI: n = 71, PE: n = 81. Horizontal line denotes the median value, box indicates the interquartile range (IQR) and whiskers denote the 1.5 × IQR. c Tcf7l1 and Tcf7l2 gene expression along pseudo-time of PE specification trajectory during the transition between E3.5 to E4.5 developmental stages, compared to gene expression levels of different lineage markers50. d Representative IF image of preimplantation embryos upon iCRT3 treatment from 2 independent experiments. Scale bar = 50 μM. e Number of NANOG+ and GATA6+ cells (counts) per embryo. Mean ± SEM; Control n = 17; iCRT3 n = 19; 2 independent experiments. multiple unpaired t tests with Holm-Sidak method. f Percentage of NANOG+ and GATA6+ cells normalized on total number of ICM per embryo. Mean ± SEM; Ctrl n = 17, iCRT3 n = 19; 2 independent experiments. g Embryo lumen volume reported in pL. Mean ± SEM; Ctrl n = 17, iCRT3 n = 19 embryos; 2 independent experiments; two-tailed unpaired t test. h Representative IF image of WT, negative control CRISPR/Cas9 and Tcf7l1−/− CRISPR/Cas9 embryos from 3 independent experiments. Scale bar=50 μM. Dashed lines delimitate lumen cavity. i–k Analysis of WT, negative control CRISPR/Cas9 and Tcf7l1−/− CRISPR/Cas9 embryos. Horizontal line denotes the median value, box refers to the 25th to 75th percentiles and whiskers mark min and max values.; WT n = 15, negative control CRISPR/Cas9 n = 19, Tcf7l1−/− CRISPR/Cas9 n = 15. 3 independent experiments. i Total number of ICM cells. No statistically significant differences using one-way ANOVA test. j Number of NANOG+ and GATA4+ cells (counts) per embryo. One-Way ANOVA test. k Embryo lumen volume reported in pL. One-Way ANOVA test. Source data for all experiments are provided as a Source data file.

