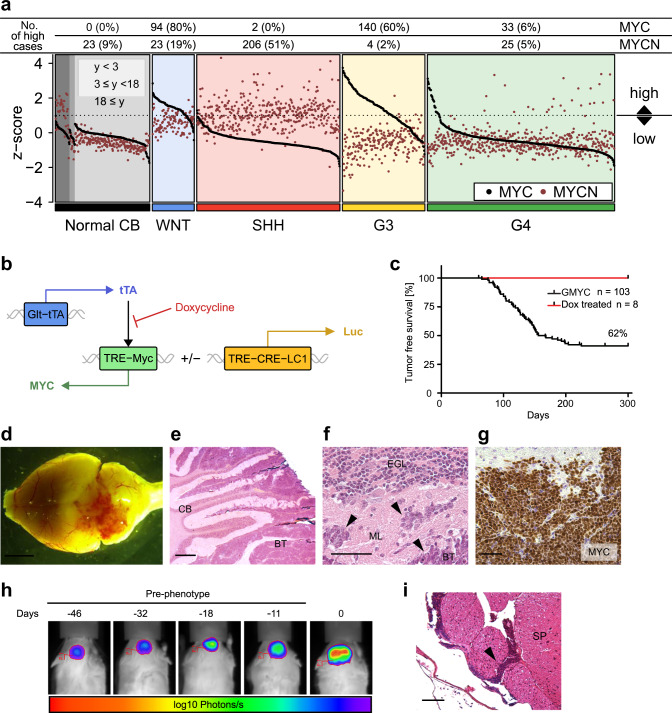
Fig. 1. MYC overexpression in GLT1 + cells generates malignant brain tumors in the hindbrain.
a Expression of MYC and MYCN across MB subgroups and normal cerebellum from infants (<3 years), children (3 ≤ years < 18) or adults (years ≥ 18). Expression is normalized across samples via z-score transformation. Samples are considered to exhibit high expression if z > 1. Data from (37). b Transgenic expression of MYC is driven through the TRE by tTA protein expressed by the Glt1 promoter. In presence of dox, tTA does not associate with TRE and transcription is ceased. Glt1-tTA-MYC mice could be bred to express the Luc1 gene under the same promoter. c Kaplan–Meier plot of GMYC survival (n = 103). GMYC mice treated with 30 days of dox (n = 8) at tumor presentation (red line) survived until experiment end at P300. Log-rank Mantel-Cox statistical test. d Gross overview of a representative GMYC mouse brain upon tumor formation. Scale bar represents 10 mm. e ×20 magnification of a GMYC cerebellum (CB) with brain tumor (BT). Infiltrative cells can be seen disrupting normal architecture of the cerebellum. Scale bar represents 500 µM. f ×40 magnification of MB cells invading the molecular layer (ML) of the cerebellum. Scale bar represents 100 µM. g Widespread MYC positivity throughout the brain tumor confirms overexpression of human MYC in the transgene. Scale bar represents 100 µM. h A GMYC/TreCRE-LC1 mouse followed (5 times) under IVIS starting 46 days before phenotypic tumor presentation (day 0). i H&E of a GMYC spinal cord displaying leptomeningeal metastasis (arrow). Scale bar represents 100 µM. H&E for e, f was performed at least once on all animals killed in c to confirm presence of tumor. In g, experimental data was verified in at least two independent experiments. G3: Group 3; G4: Group 4.

