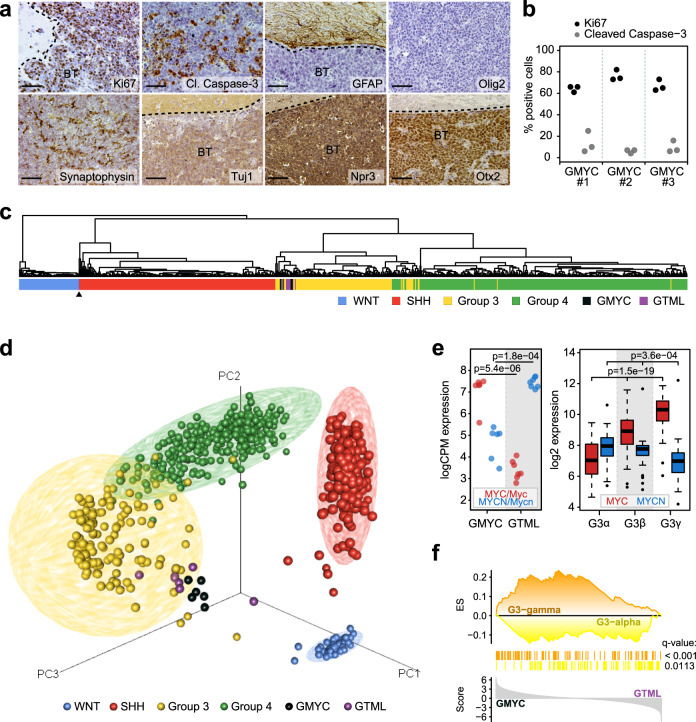
Fig. 2. GMYC tumors resemble distinct human MYC-driven Group 3 MB subtypes.
a ×20 magnification. Immunostaining for Ki67 shows a proliferative tumor with pockets of apoptotic cells (Cleaved caspase-3). Brain tumors (BT) stained mostly negative for GFAP and Olig2, had moderate levels of Synaptophysin, TuJ1, and Npr3, and strong Otx2 positivity confirming similarity to a non-SHH MB-like tumor. Scale bar represents 100 µM. b Quantification of Ki67 and Cleaved Caspase-3 activity from three representative micrographs in three individual tumors. c Hierarchical clustering following cross-species projection of GTML (n = 8) and GMYC (n = 6) tumors onto human MB samples (n = 737; GSE85217). The black arrow indicates a single GTML sample that clustered with the SHH subgroup. d PCA plot following cross-species projection of GTML (n = 8) and GMYC (n = 6) tumor models onto human MB samples (n = 737; GSE85217). e Myc/MYC and Mycn/MYCN expression levels in GMYC (n = 6) and GTML (n = 7) models (left) and in MB Group 3 alpha (n = 67), beta (n = 37) and gamma (n = 40) subsets (right). P-values indicate the results of a two-sided Welch’s t-test (left) or a one-way ANOVA (right). f Result of a targeted GSEA comparing GMYC (n = 6) and GTML (n = 7) tumors against gene sets consisting of genes upregulated in respectively G3-gamma or G3-alpha human Group 3 MBs (from GSE85217).All experimental data from immunostaining was verified in at least two independent experiments. SA: Senescence-associated.

