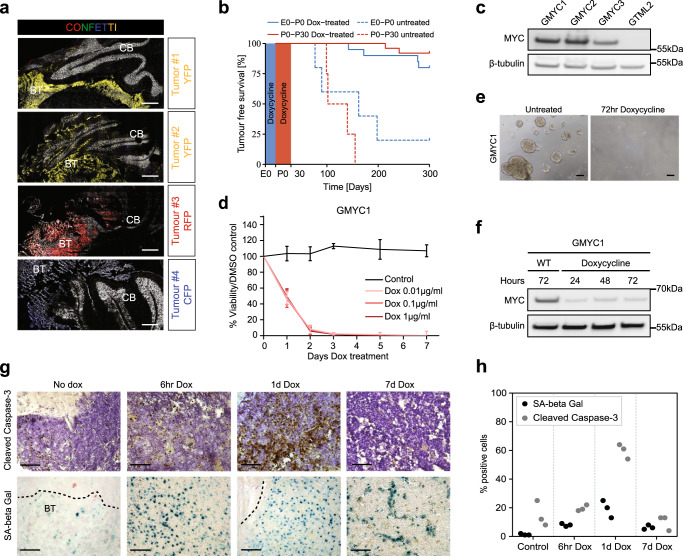
Fig. 3. GMYC tumors arise clonally during embryonal development and can be maintained in vitro.
a ×20 magnification. GMYC/Confetti strain of mice suggested that developing tumors (n = 4) were of monoclonal origin. Scale bars represent 200 µM. b Survival plot of GMYC mice at different windows of embryonic and post-natal dox-treatment. Red line indicates mice who received dox treatment from P0 to P30. Dashed red line is untreated controls from the same breeding. Blue line indicates mice who received dox treatment from embryonic exposure during the mother’s gestation until birth (P0). Dashed blue line is untreated controls from the same breeding. c Protein analysis of lysates taken from GMYC cell lines expanded in vitro show high levels of MYC expression. Cells from the GTML model do not overexpress MYC protein. d GMYC cells can be dox-treated in vitro and are rapidly ablated following exposure. n = 3 for each treatment variable. Mean ± SD. e Micrograph of GMYC1 cells growing in vitro, both untreated and treated for 72 hours with dox. Scale bars represent 100 µM. f Protein analysis of dox-treated GMYC1 cells in vitro. MYC levels are rapidly diminished upon dox (1 µg/ml) treatment. g In vivo dox-treatment reveals that tumors rapidly undergo apoptosis following loss of MYC. A proportion of cells are pushed into a senescent state. This response peaks following 24 h of dox-treatment. Scale bars represent 100 µM. h Quantification of cleaved caspase-3 and SA-β Gal activity from three representative micrographs as seen in g. Blots in c and f are representative data from a minimum of three biological replicates. All experimental data from treatments (d, e, g) were verified from at least two independent biological replicates. CB cerebellum, BT brain tumor.

