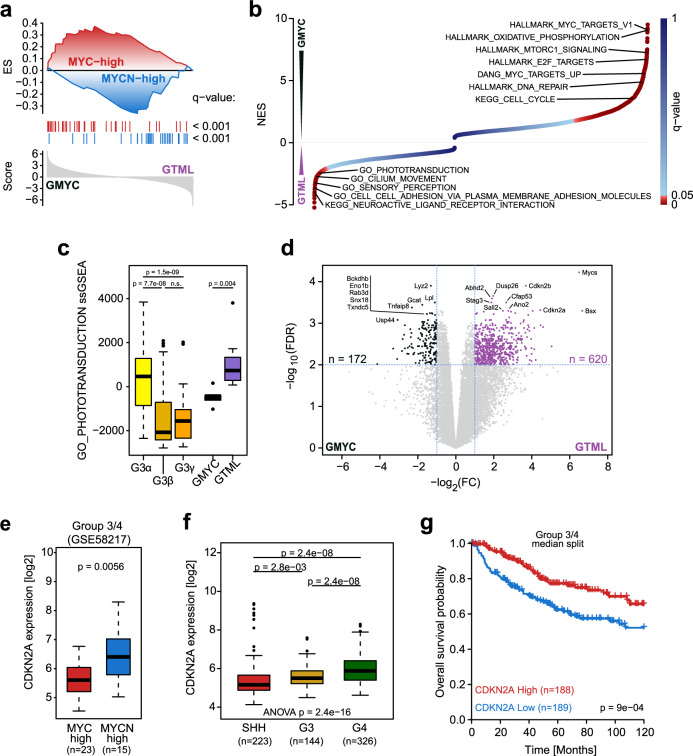
Fig. 4. MYC and MYCN-driven tumors have distinct profiles with low ARF levels in GMYC MBs.
a Results of a targeted GSEA comparing the differential expression of genes between GMYC (n = 6) and GTML (n = 7) tumors against gene sets consisting of genes upregulated in respectively MYC-high or MYCN-high human Group 3 MBs (from Supplementary Fig. 3d). b Illustration of normalized enrichment scores (NES) obtained from an unbiased GSEA comparing GMYC (n = 6) and GTML (n = 7) tumors. Significantly enriched gene sets for GMYC (NES > 0) and GTML (NES < 0) are indicated as red dots. c Boxplot depicting ssGSEA enrichment scores for the phototransduction gene set identified in b between subsets of human Group 3 MBs (from GSE85217), GMYC (n = 6), and GTML (n = 7) models. P-values indicate the results of two-sided Wilcoxon Mann-Whitney rank sum tests (n.s.: p > 0.05). d Volcano plot depicting the differential expression between the 7 GTML and 6 GMYC tumor samples classified as Group 3 MB. The 10 top significantly (as measured by lowest FDR-values) genes for each model are highlighted. The horizontal dashed line indicates the FDR = 0.01 threshold, while the vertical dashed lines indicate a logFC of -1 or 1, respectively. The Myc and Mycn genes were removed from the ranked gene list. e Box plot comparing the expression of CDKN2A between MYC-high and MYCN-high Group 3/4 samples (see also Supplementary Fig. 3g). P-value was computed using two-sided Welch’s t-test. f Box plot comparing the expression of CDKN2A between SHH, Group 3, and Group 4 MB samples. P-value was computed using two-sided Welch’s t-test. g Kaplan–Meier plots comparing the survival of patients with low and high gene expression of CDKN2A within the Group 3 or Group 4 subsets (from GSE85217). Within each subset, the sample groups were established by separating samples based on the median expression of CDKN2A. Log-rank Mantel-Cox statistical test.

