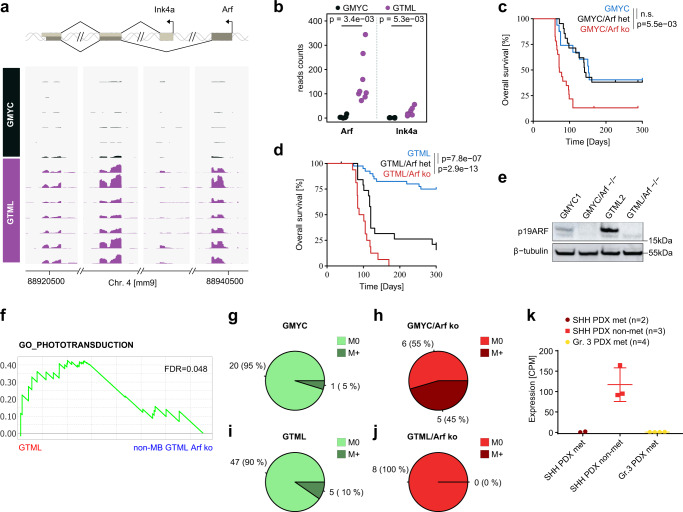
Fig. 5. Loss of ARF increases tumorigenicity, metastasis, and promotes HGG-driven malignancy.
a Schematic display of transcriptional expression (of indicated exons) for Arf and Ink4a transcripts (from RNA-Seq) aligned to the CDKN2A locus on mouse Chromosome 4 between individual GMYC (n = 6) and GTML (n = 7) tumors. b Strip chart comparing the read counts for Arf or Ink4a, respectively, between GMYC and GTML tumors. P-values indicate the results of a two-sided Welch’s t-test. c-d Kaplan-Meier plots comparing the subsequent changes in penetrance and survival following heterozygous and homozygous loss of Arf in the GMYC and GTML models. Heterozygous loss had no effect on overall survival for GMYC mice (p > 0.05), whereas homozygous loss dramatically increased penetrance and reduced overall survival (p = 5.5e-03). In the GTML model, heterozygous loss increased tumor penetrance and reduced overall survival (p = 7.8e-07), and homozygous loss impacted overall survival further (p = 2.9e-13). Log-rank Mantel-Cox statistical test. e Protein analysis of p19ARF in GMYC and GTML cell lines established from in vivo material, then grown in vitro. Following complete knockout of the Arf gene there is subsequent total reduction of protein product. f GSEA analysis of GO_PHOTOTRANSDUCTION with a significant enrichment in GTML cells (MB-like) as compared non-MB GTML cells. Enrichments were considered significant if FDR < 0.05. g–j Comparison of metastatic events observed in the GMYC and GTML models upon complete knockout of Arf. GMYC model had relatively few events of metastasis, 1 in 21 (5%). However, with homozygous loss of Arf, many mice harbor metastasis, 5 in 11 (45%). In GTML metastasis was observed for 5 out of 52 tumors (10%). This did not increase upon homozygous loss of Arf, 0 in 8(0%). k CDKN2A expression (RNA-seq) levels in individual MB PDXs for SHH met (n = 2), SHH non-met (n = 3) and Gr. 3 met (n = 4) medulloblastoma subgroups (from GSE106728) show that heavily suppressed CDKN2A levels coincide with metastatic dissemination. Scatter dot plot presented as mean values ± SD. Experimental data from immunostainings (e) was verified in at least two independent biological replicates.

