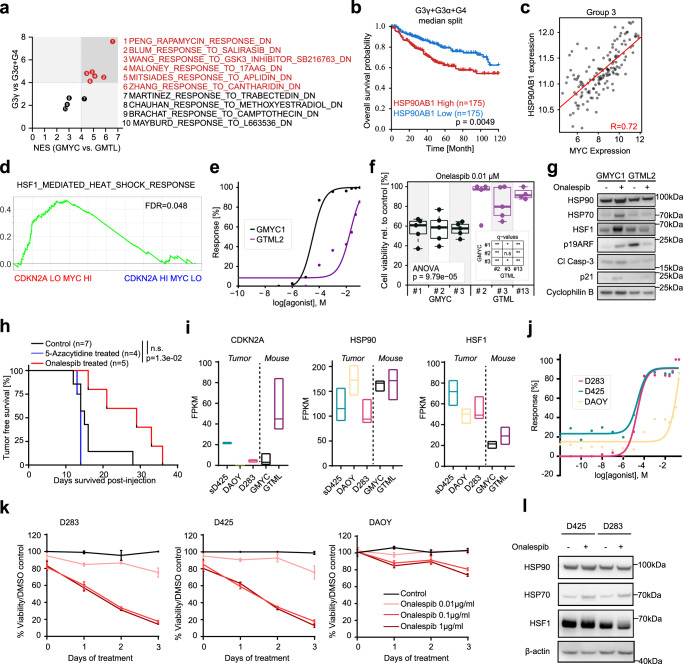
Fig. 7. HSP90 inhibition suppresses MYC-driven tumors in an ARF-dependent way.
a Normalized enrichment scores (NES) of 10 drug gene sets between the GMYC-vs-GTML GSEA analysis and G3γ-vs-G3α + G4 GSEA analysis. Gene signatures were identified as the top 10 significant gene sets reported to be repressed by drug treatment and upregulated in GMYC. Lines indicate a threshold of NES = 4 and red highlighted drug gene sets indicate the top candidates with a NES > 4 in both GMYC and G3γ. b Kaplan-Meier plot comparing difference (log-rank (Mantel-Haenszel) test) of overall survival between G3γ + G3α + G4 MB patients with high (top 25%) or low (bottom 25%) expression of HSP90AB1. c Scatter plot comparing expression of HSP90AB1 with MYC in Group 3 MBs. R-value = Pearson correlation coefficient. d GSEA analysis of REACTOME_REGULATION_OF_HSF1_MEDIATED_HEAT_SHOCK_RESPONSE with significant enrichment (FDR < 0.05) in MYC high/CDKN2A low Gr. 3 patients. e Significant dose response (p < 0.05; Student’s t test) of onalespib-treated GMYC cells compared to GTML cells. f GMYC and GTML cells treated with the calculated GMYC1 EC50 value for onalespib concentration. ANOVA analysis shows a significant difference in response between cell lines. P-values indicate the results of a one-way ANOVA. g Protein analysis of GMYC1 and GTML2 cells treated with approximate EC50 values of onalespib for 24 h. Treated GMYC1 cells show an increase in HSP70, HSF1, ARF, apoptotic activity, and p21 induction compared to their untreated state and as compared to treated GTML2 cells. h Onalespib (compared to control or 5-Azacytidine) treatment significantly increased the survival time for mice engrafted with GMYC/TetGFP/Luc cells (Log-rank Mantel-Cox statistical test). i Expression analysis (from GSE107405) from tumor biopsies from our GMYC and GTML animal models and patient derived MB cell lines (sD425, DAOY, D283). Floating bars min to max with a median center line. j Dose response curve showing a significant response of onalespib-treated MYC-driven, CDKN2A-present D283 and sD425 human cells compared to the DAOY cell line which has minimal expression of MYC and CDKN2A. k D283, sD425, and DAOY cell lines treated with onalespib in vitro over 3 days. Mean ± SD. l Protein analysis of onalespib-responsive sD425 and D283 cell lines treated with onalespib for 24 hours in vitro. Treated cells show an increase in HSP70 protein levels. Data from immunostainings (g, l) and treatments (e, j, k) was verified from at least two independent biological replicates.

