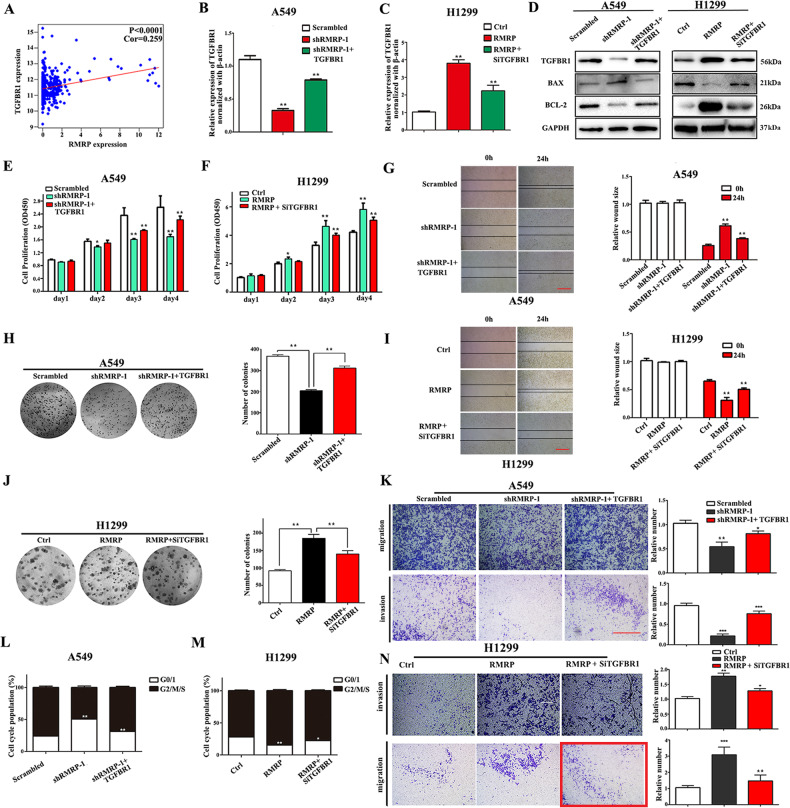
Fig. 4. TGFBR1 is a critical target by which RMRP promotes proliferation, invasion, and migration.
A The TCGA database of lung adenocarcinoma showed a positive correlation between the expressions of TGFBR1 and RMRP (n = 594). B Results of qRT-PCR analysis showing the expression of TGFBR1 mRNA in A549 cells after being transfected with shRMRP or TGFBR1-overexpressing plasmid (shRMRP + TGFBR1) as well as their respective negative controls. C Results of qRT-PCR analysis showing the expression of TGFBR1 mRNA in H1299 cells after being transfected with RMRP or short interference RNAs for TGFBR1 (RMRP + SiTGFBR1) as well as their respective negative controls. D Western blot analysis of the treated A549 and H1299 cells using the indicated antibodies (n = 3). E CCK-8 assays of the treated A549 cells (n = 3). F CCK-8 assays of the treated H1299 cells (n = 3). G Representative images (Left) and quantification (Right) of the wound-healing assays of the treated A549 cells (n = 3, Scale bar, 200 μm). H Representative images (Left) and quantification (Right) of colony formation assay of the treated A549 cells (n = 3). I Representative images (Left) and quantification (Right) of the wound-healing assays in the treated H1299 cells (n = 3). J Representative images (Left) and quantification (Right) of colony formation assay of the treated H1299 cells (n = 3). K Representative images (Left) and quantification (Right) of the transwell assays including invasion and migration of the treated A549 cells (n = 3). L The cell cycle assays of the treated A549 cells (n = 3). M The cell cycle assays of the treated H1299 cells (n = 3). N Representative images (Left) and quantification (Right) of the transwell assays including invasion and migration of the treated H1299 cells (n = 3, Scale bar, 200 μm). Data presented as mean ± SD from at least three independent experiments. *P < 0.05, **P < 0.01, ***P < 0.001.

