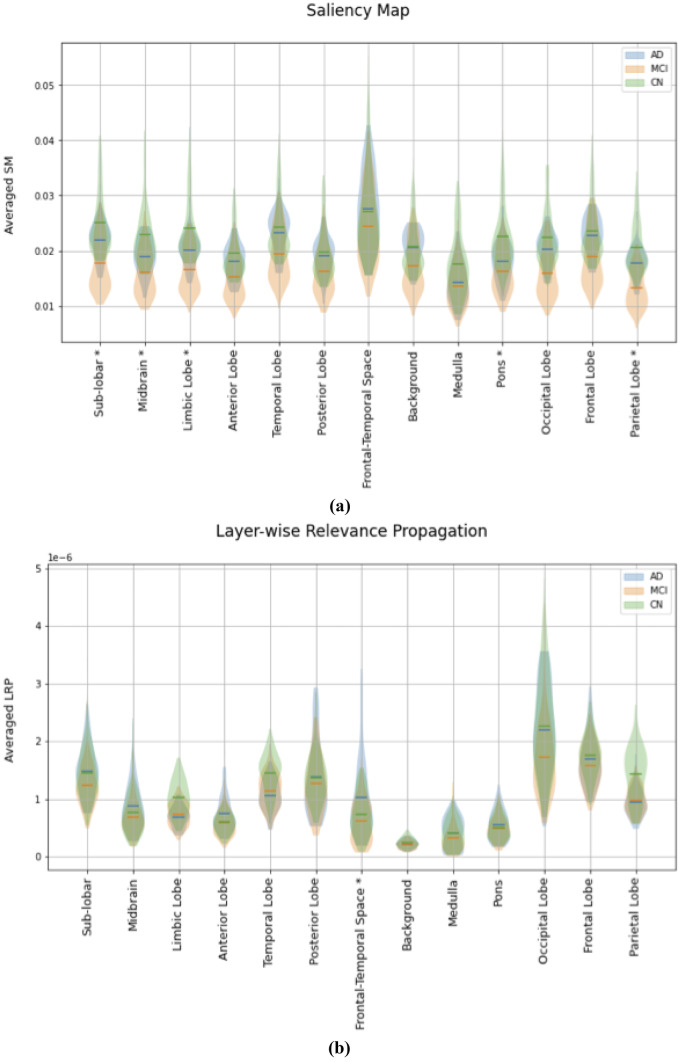
Fig. 5.
Violin Plots for the evaluation of the average in each brain atlas’ region of the SM (a) and LRP (b) for correctly classified subject. Horizontal lines show the average value for all AD (blue), MCI (orange) and CN subjects (green) in the test set correctly classified; shaded areas (blue, orange and green shaded area for AD MCI and CN respectively) show the distribution of these values. ‘*’ denotes where the statistical inference highlighted a significant difference between the distribution in all the three classes

