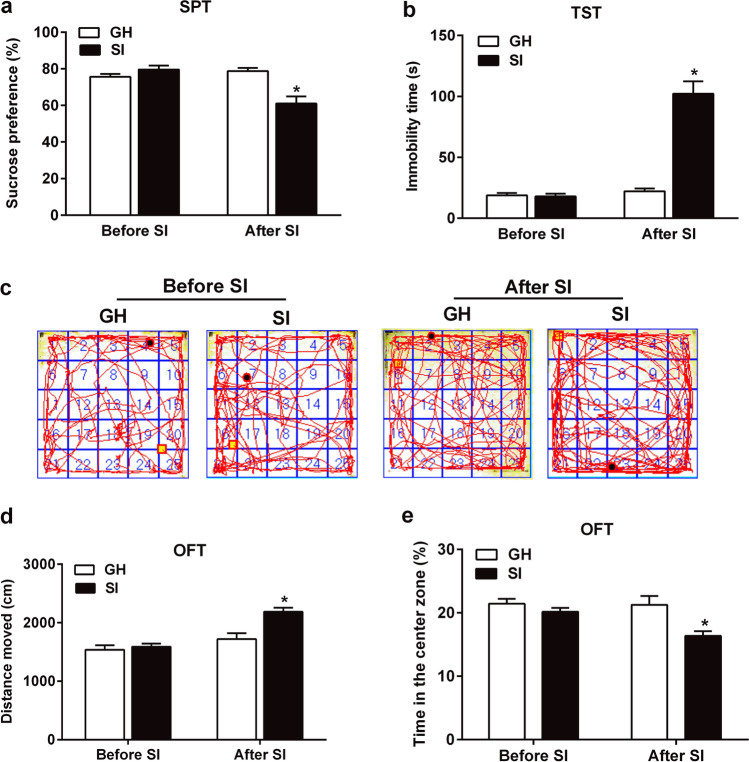
Fig. 2.
Six weeks of social isolation stress induced depressive- and anxious-like behavioral deficits. a Changes of sucrose preference percentage in the SPT before and after SI. b Changes of immobility time in the TST before and after SI. c Moving trajectory diagram in the OFT. d Changes of total distance of motor activity in the OFT before and after SI. e Changes of spent time in the center zone in the OFT before and after SI. The data were expressed as mean ± SEM (n = 8). *P < 0.05, SI group versus GH group. SI social isolated, GH group housed, SPT sucrose preference test, TST tail suspension test, OFT open field test

