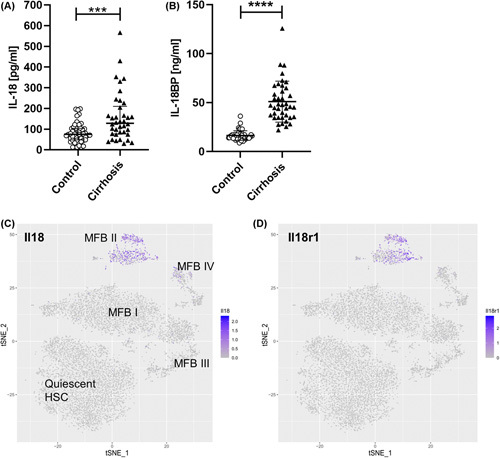
FIGURE 1.

IL‐18 signaling impacts liver fibrosis/cirrhosis in humans and mice. (A) Circulating IL‐18 levels in patients with NASH‐induced liver cirrhosis (128.4 pg/ml; 76.48–209.8 pg/ml) compared with healthy controls (74.9 pg/ml; 47.73–103.1 pg/ml). (B) Serum IL‐18BP of patients with liver cirrhosis (46.50 ng/ml; 34.89–64.07 ng/ml) in comparison with the control group (15.36 ng/ml; 13.50–17.84 ng/ml). Data shown: median; IQR. (Control, n = 50; Liver cirrhosis, n = 38; ****p < 0.0001; Mann–Whitney U test). T‐SNE plots mapping distribution of HSCs expressing (C) Il18 and (D) Il18r1. Activated HSCs from CCl4‐treated mice that induce liver fibrosis were differentiated into four subpopulations (MFB I to MFB IV) according to their different gene expression patterns.31 T‐SNE plots show that especially HSCs from the immunoregulatory MFB II cluster express Il18 and Il18r1. BP, binding protein; CCl4, carbon tetrachloride; HSC, hepatic stellate cell; IQR, interquartile range; MFB, myofibroblast; t‐SNE, T‐distributed stochastic neighbor embedding.
