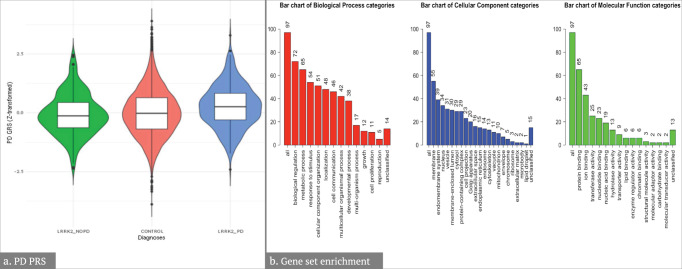
Fig. 2. Results from the GWAS-level and post-GWAS analyses projects.
a Violin plots comparing z-transformed Parkinson’s disease (PD) genetic risk score distributions in PD-LRRK2 cases, non-PD-LRRK2 carriers, and controls. Within the violins, box plots display the median and the bounds of the box correspond to the 25th and 75th percentiles. The upper and lower limits of the whiskers correspond to 1.5 times the limits of the 25th and 75th percentiles. PD-LRRK2 individuals had a higher risk of developing PD compared to control LRRK2 mutation carriers (OR = 1.60, 95% CI = 1.33–1.93, P = 1.1 × 10⁻⁶). The mean of the unadjusted GRS score was also significantly higher in PD-LRRK2 cases compared to non-PD-LRRK2 carriers (P = 2.9 × 10⁻⁶) and controls (P = 5.1 × 10⁻⁷) in the pairwise Wilcoxon rank-sum test. b Summary of input genes from WebGestalt showing the number of PD genes (from GWAS significant SNPs) which overlap with the annotated genes in the Gene Ontology Slim terms from the biological process, cellular component, and molecular function.

