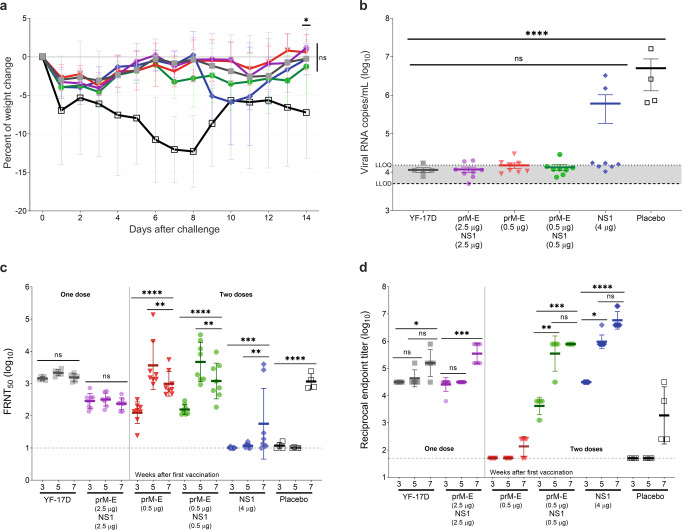
Fig. 1. YFV-based mRNA-LNP vaccines elicit protective titers and protect against intramuscular (IM) YFV challenge in A129 mice.
Mice received one immunization with one-tenth of the human dose of YF-17D vaccine (close square; gray) or bivalent YF prM-E/NS1 mRNA-LNPs (2.5 µg each) (hexagon; violet), or two immunizations with 0.5 µg of YF prM-E mRNA-LNP (inverted triangle; red), 0.5 µg each of YF prM-E and NS1 mRNA-LNPs (circle; green), 4 µg of YF NS1 mRNA-LNP (diamond; blue), or diluent as placebo control (open square; black) 21 days apart. Five weeks later, on day 35, mice were infected IM with 1 × 10⁴ plaque-forming units (PFU) of YFV BeH 622205 strain. Panel a shows the percentage of the body weight change (±SD) of the animals over a period of 14 days post challenge. b Serum viral load (line indicates GMT ± standard error of the mean [SEM]) measured 6 days after challenge by qRT-PCR. Antibody responses were measured in serum 21 days after the first vaccination (week 3), 14 days after the second vaccination (week 5), and 14 days after challenge (week 7). Panel c shows the neutralizing antibody titers measured by FRNT50 (GMT ± geometric standard deviation [GSD]). d Enzyme-linked immunoassay (ELISA) data showing anti-YFV NS1-specific antibody titers (GMT ± GSD). Dashed line indicates the lower limit of detection (LLOD), and dotted line shows the lower limit of quantification (LLOQ), *p < 0.05, **p < 0.01, ***p < 0.001, ****p < 0.0001, ns = not significant. One-way analysis of variance (ANOVA) followed by Dunnett’s or Dunn’s multiple comparisons test for viral load and ELISA data, respectively, or two-way ANOVA followed by Tukey’s multiple comparisons test for neutralizing antibody titers and weight changes was performed using GraphPad Prism. Statistical analysis of the FRNT50 titers was performed after log-transformation of the data and assessed for normality using a Q–Q (quantile-quantile) plot.

