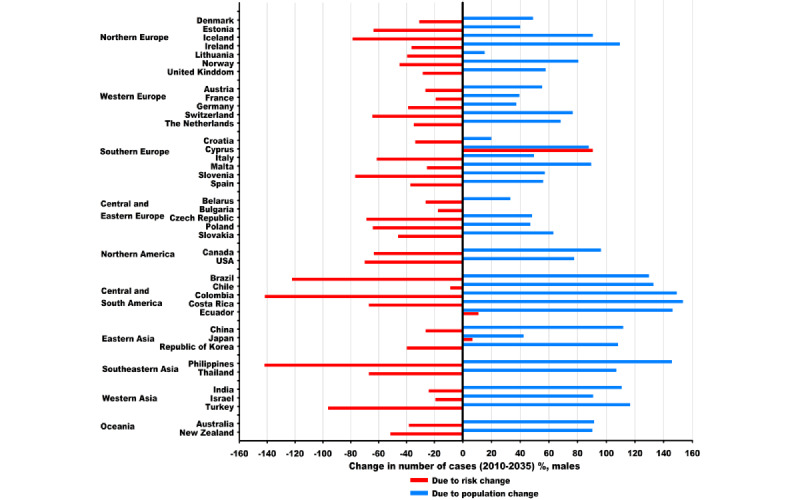
Figure 6.

Projected changes in the number of new lung cancer cases between 2010 and 2035 in 40 countries among males, partitioned into population and risk change. Numbers for 2010 and 2035 represent average numbers for the 5-year period centered on the respective year. Due to population change: projected change in the number of cases due to population growth and aging. Due to risk change: projected change in the number of cases due to changes in incidence rates. Blue color stands for population change, and red color stands for risk change.
