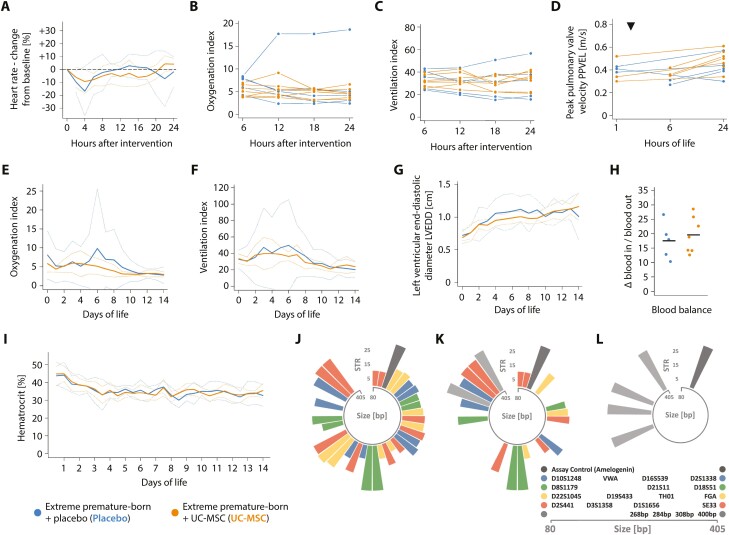
Figure 2.
Controlled administration of MSC is safe in critically ill, extremely premature-born baboons. Progression of the (A) heart rate, (B) oxygenation index, (C) ventilation index and the (D) peak pulmonary valve velocity (PPVEL) after administration of UC-MSC or placebo, respectively. PPVEL integrates pulmonary perfusion and pulmonary arterial pressure and is expected to drop in cases of substantial changes in pulmonary vascular resistance or right ventricular function (eg, in cases of significant pulmonary arterial obstructions due to the intravenously administered cells). Every graph/ line in (B-D) represents data from one animal; data is presented as averaged over 120 minutes (A) or six hours (B, C). Echocardiographic studies depicted in (D) were either performed prior to (three animals receiving placebo, three UC-MSC) or four hours after the intervention (two animals receiving placebo, three UC-MSC) and again after 24 hours of life in all animals. The timepoint of intervention is indicated with a triangle (▼). See Supplementary Fig. S1 for information on the clinical course and progression of adverse events in a single extremely premature-born baboon receiving UC-MSC over two minutes and Supplementary Fig. S2 for information on the renal function of the investigated animals. Progression of (E) the oxygenation and (F) the ventilation index over 2 weeks of neonatal critical care, depicted as group means (solid curves) and 95% confidence interval of the means (dotted curves), averaged over 24-hour intervals. (G) Progression of the left ventricular end-diastolic diameter (LVEDD), an estimator of ventricular volume in situations with active left-to-right shunting through an open ductus arteriosus. Data is also depicted as group mean with CI95%. The first echocardiographic study was performed between the first and sixth hour of life (timepoint zero), thereafter every day. (H) Blood balance (ie, the difference between transfused and withdrawn blood volumes) on day of life 14, summed up over the entire course of neonatal intensive care. Horizontal bars indicate group means. (I) Temporal progression of the hematocrit during neonatal critical care, averaged over 12-hour intervals. No significant (P < .05) differences between groups by Mann-Whitney-U (H) or Welch’s two-sided, unequal variance t-test with test level adjustment using Šidák’s correction, comparing data for every timepoint (A-G, I). Circular barplots (J-L) depicting size (in base pairs—bp—on the circular x-axis) and number of short tandem repeats (y-axis) on each allele of investigated short tandem repeat (STR)-loci. Equally coloured bars of comparable transcript size indicate the two alleles of an STR-locus, the single dark-grey bar the assay control (amelogenin) and the light-grey bars the four baboon-specific, constant amplificates. STR signature of (J) the employed cell product and (K) an arterial blood sample drawn after approximately one third of the cell dose was given intravenously (positive control). (L) Representative result of an STR analysis of blood drawn 24 hours (n = 7) or 72 hours (n = 7) after cell administration; or of systematic—uniform sampled pieces of spleen (n = 4), liver (n = 4), or lung (n = 7) obtained on day of life 14 after cell administration. All samples were analysed individually, and 2-4 of the baboon-specific, constant amplificates (light grey) were found per sample and animal besides the assay control (dark grey). Moreover, several human STR-patterns not matching the pattern of the injected cell product were detected in samples and tracked down to the researchers performing the necropsies (not shown).

