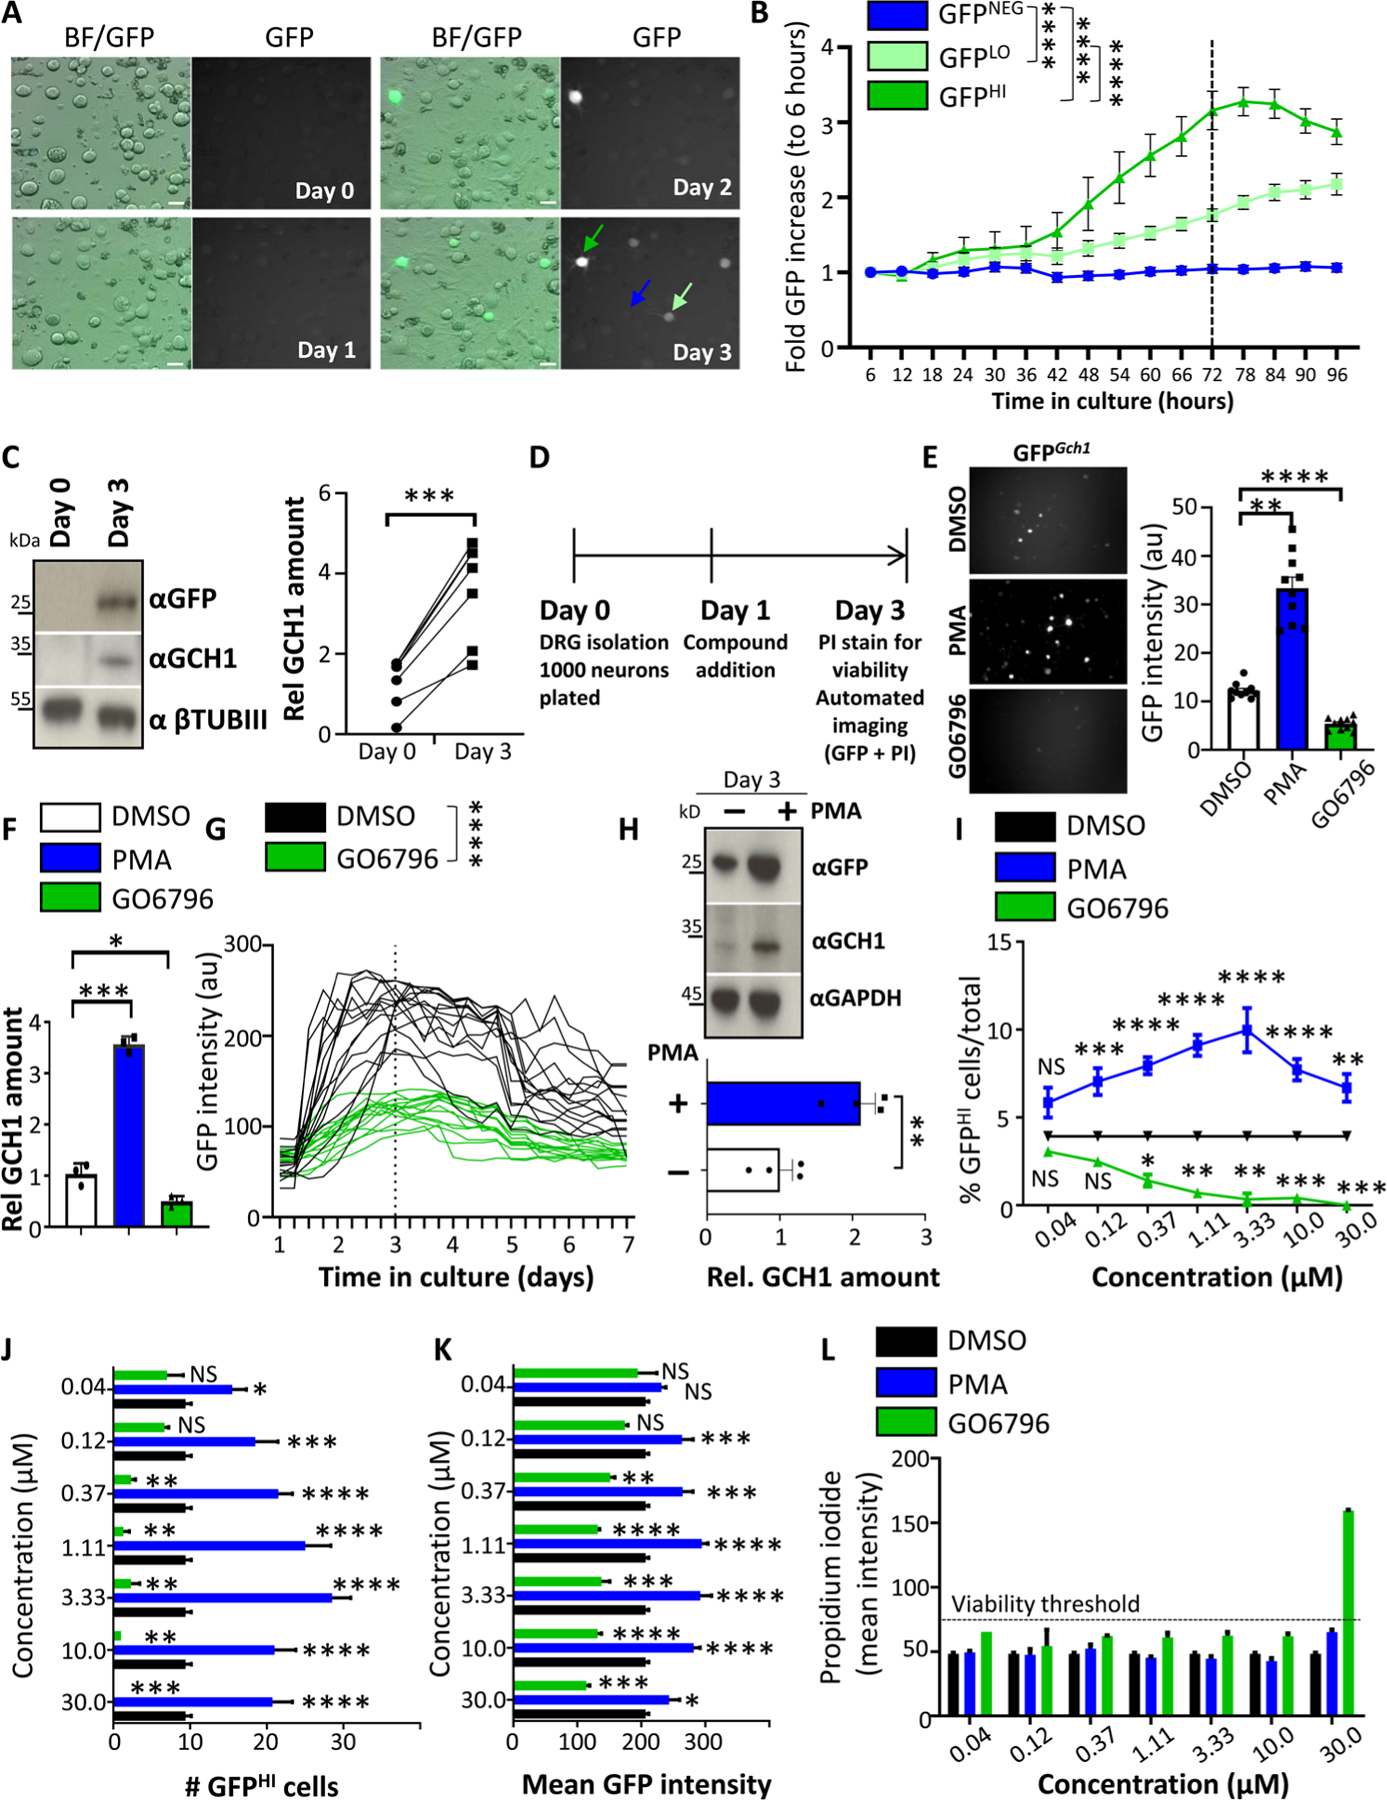
Fig. 1. DRG drug screen identifies PKC as an inducer of Gch1 expression.

(A and B) Brightfield and fluorescent GFP images of cultured DRG neurons over time isolated from Gch1GFP reporter mice (A) and quantification of increased GFP intensity (B) from GFP high–expressing (dark green arrow), GFP low–expressing (light green arrow), and GFP-negative (blue arrow) DRG neurons. Scale bars, 30 μm. Data are shown as means ± SEM. ****P < 0.0001 (two-way repeated-measures ANOVA). (C) Representative Western blot analysis of cultured DRG neurons on days 0 and 3 blotted with specific antibodies to detect GFP (top) and GCH1 (middle blot). Neuronal-specific anti–β-tubulin III (βTubIII) was used as a loading control (bottom blot). Relative quantification of GCH1 protein on days 0 and 3 of DRG culture from wild-type animals (right). Data are shown as means ± SEM and pooled from five independent experiments. Individual samples are shown. ***P < 0.001 (paired t test). (D) Schematic time frame of the drug screen on cultured DRG neurons from Gch1GFP reporter mice. Compounds were added to the culture on day 1, and GFP as well as propidium iodide (PI) quantification and intensity were analyzed on day 3. (E) Representative GFP fluorescent images and quantification of GFP intensity from wells of cultured (day 3) DRG neurons isolated from Gch1GFP reporter mice treated with PKC modifier drugs [PMA (3 μM), which activates PKC; GO6796 (0.3 μM), which inhibits PKC] on day 1. Data are shown as means ± SEM. Individual samples are shown. **P < 0.01; ****P < 0.0001 (one-way ANOVA with Dunnett’s multiple comparison test). au, arbitrary units. (F) Validation of the effect by PKC regulation on Gch1 expression by RT-qPCR on DRG neurons from wild-type animals treated with DMSO as vehicle control, PMA (3 μM), and GO6796 (0.3 μM). Data are shown as means ± SEM. Individual samples for each treatment condition are shown. *P < 0.05; ***P < 0.001 (one-way ANOVA with Tukey’s multiple comparison test). (G) GFP intensities over time of individual GFP-expressing DRG neurons isolated from Gch1GFP reporter mice and treated with DMSO and GO6796 (0.3 μM) 24 hours after plating. Data are shown as means ± SEM. Individual intensities over time are shown. ****P < 0.0001 (two-way repeated-measures ANOVA). (H) Representative Western blot of GFP and GCH1 on DRG neurons isolated from Gch1GFP reporter mice treated with PMA (3 μM). GAPDH was used as a loading control (top). Relative quantification of GCH1 protein on day 3 of DRG culture from wild-type animals untreated and treated with PMA (3 μM) (bottom). Data are shown as means ± SEM and pooled from three independent experiments. Individual samples are shown. **P < 0.01 (paired t test). (I to K) Analysis of various parameters on day 3 of cultured Gch1GFP DRG neurons treated with the indicated doses of PMA and GO6796 as well as the DMSO vehicle control (note that DMSO concentration was kept constant at 0.1%) including % GFPHI cells among total identified neurons (I), total numbers of GFPHI neurons per well (J), and mean GFP intensity per well (K). Data are shown as means ± SEM. *P < 0.05; **P < 0.01; ***P < 0.001; ****P < 0.0001; NS, not significant (one-way ANOVA with Dunnett’s multiple comparison test to DMSO treatment). (L) Mean intensity of PI staining per well as a measure of toxicity. PI intensity greater than 75 was arbitrarily taken to be considered toxic (dotted black line). Note toxicity of GO6796 at a concentration of 30 μM. Data are shown as means ± SEM.
