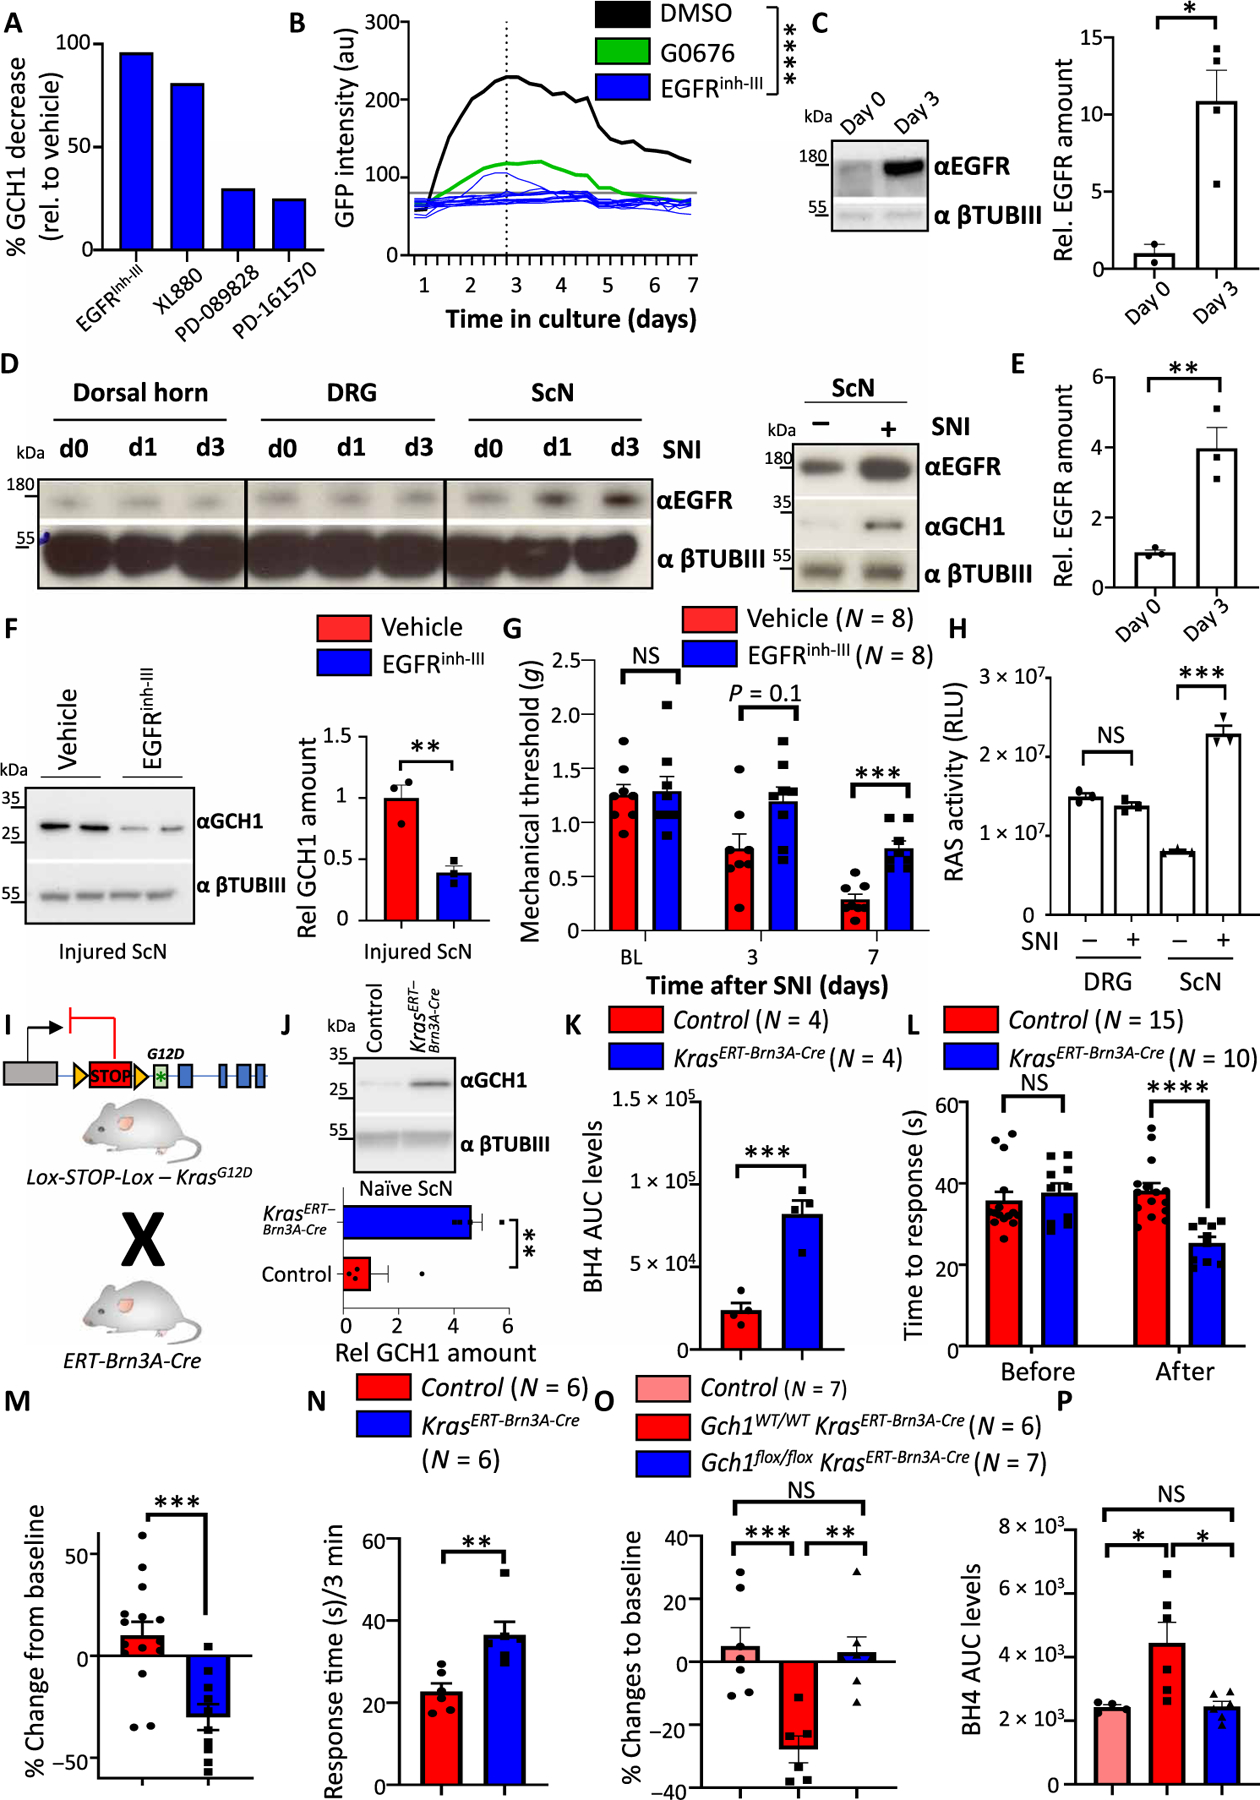
Fig. 4. EGFR signaling regulates the GCH1/BH4 pathway in sensory neurons.

(A) Quantification of GCH1 protein reduction on DRG cultures from wild-type mice by several compounds that target EGFR signaling; see fig. S5B for Western blot. (B) GFP intensities over time of individual GFP-expressing DRG neurons treated with EGFR inhibitor III (EGFRinh-III) (10 μM) isolated from Gch1GFP reporter mice. DMSO and GO6796 (0.3 μM) treatments from Fig. 1F are also shown. Individual intensities over time are shown for EGFRinh-III. ****P < 0.0001 (two-way repeated-measures ANOVA between DMSO and EGFRinh-III). (C) Rep resentative Western blot and quantification of EGFR protein in cultured DRG cells on days 0 and 3. βTubIII was used as a loading control. Data are shown as means ± SEM and pooled from two independent experiments. Individual mice for each condition are shown. *P < 0.05 (Student’s t test). (D) Western blot of EGFR in the injured ipsilateral dorsal horn, DRGs, and sciatic nerve assayed at days 0 and 1 and 3 days after SNI (left). Western blot of EGFR and GCH1 in the DRG and sciatic nerve of naïve and 3-day SNI-treated wild-type animals (right). βTubIII was used as a loading control. (E) Relative quantification of EGFR in sciatic nerve tissue in naïve and SNI-treated animals from fig. S10C. Data are shown as means ± SEM. Individual mice for each condition are shown. **P < 0.01 (Student’s t test). (F) Representative Western blot of GCH1 in the sciatic nerve of 3-day SNI-operated wild-type animals treated with vehicle or EGFRinh-III (10 mg/kg). βTubIII was used as a loading control. Data are shown as means ± SEM and pooled from two independent experiments. Individual mice for each condition are shown. **P < 0.01 (Student’s t test). (G) Mechanical thresholds of SNI wild-type animals treated with vehicle and EGFRinh-III (10 mg/kg). Treatment was administered intraperitoneally for 2 days before each behavioral testing. Data are shown as means ± SEM. Individual mice for each genotype are shown. ***P < 0.001 (two-way ANOVA with Sidak’s multiple comparison test). (H) Ras activity in naïve and 3-day SNI-treated animals from DRG and sciatic nerve tissues. Data are shown as means ± SEM. Individual mice for each genotype are shown. ***P < 0.001 (one-way ANOVA with Tukey’s multiple comparison test). (I) Breeding scheme for inducible expression of constitutively active KrasG12D in sensory neurons. (J) Western blot of GCH1 in naïve DRG tissue from tamoxifen-treated control and Kras; ERT-Brn3A-Cre mice. Tissue was extracted 8 weeks after tamoxifen treatment (five times daily, 2 mg per mouse). βTubIII is shown as a loading control. (K) BH4 measurements in the sciatic nerve of naïve control and Kras; ERT-Brn3A-Cre mice 8 weeks after tamoxifen administration. Data are shown as means ± SEM. Individual mice for each genotype are shown. ***P < 0.001 (Student’s t test). (L and M) Hot-plate behavioral testing of control and Kras; ERT-Brn3A-Cre mice at baseline (L) and percentage change in response (M) as determined 8 weeks after tamoxifen administration. Data are shown as means ± SEM. Individual mice for each genotype are shown. ***P < 0.001; ****P < 0.0001 [one-way ANOVA with Tukey’s multiple comparison test (L) and Student’s t test (M)]. (N) Response time to capsaicin (1 μg) intradermal paw injection of control and Kras; ERT-Brn3A-Cre mice 8 weeks after tamoxifen administration. Data are shown as means ± SEM. Individual mice for each genotype are shown. **P < 0.01 (Student’s t test). (O) Percent change in hot-plate (50°C) latencies of control, Kras; ERT-Brn3A-Cre, and Gch1flox/flox; Kras; ERT-Brn3A-Cre mice at baseline and 8 weeks after tamoxifen administration. Data are shown as means ± SEM. Individual mice for each genotype are shown. **P < 0.01; ***P < 0.001 (one-way ANOVA with Tukey’s multiple comparison test). (P) BH4 measurements in the sciatic nerve of naïve control, Kras; ERT-Brn3A-Cre, and Gch1flox/flox; Kras; ERT-Brn3A-Cre mice 8 weeks after tamoxifen administration. Data are shown as means ± SEM. Individual mice for each genotype are shown. *P < 0.05 (one-way ANOVA with Tukey’s multiple comparison test).
