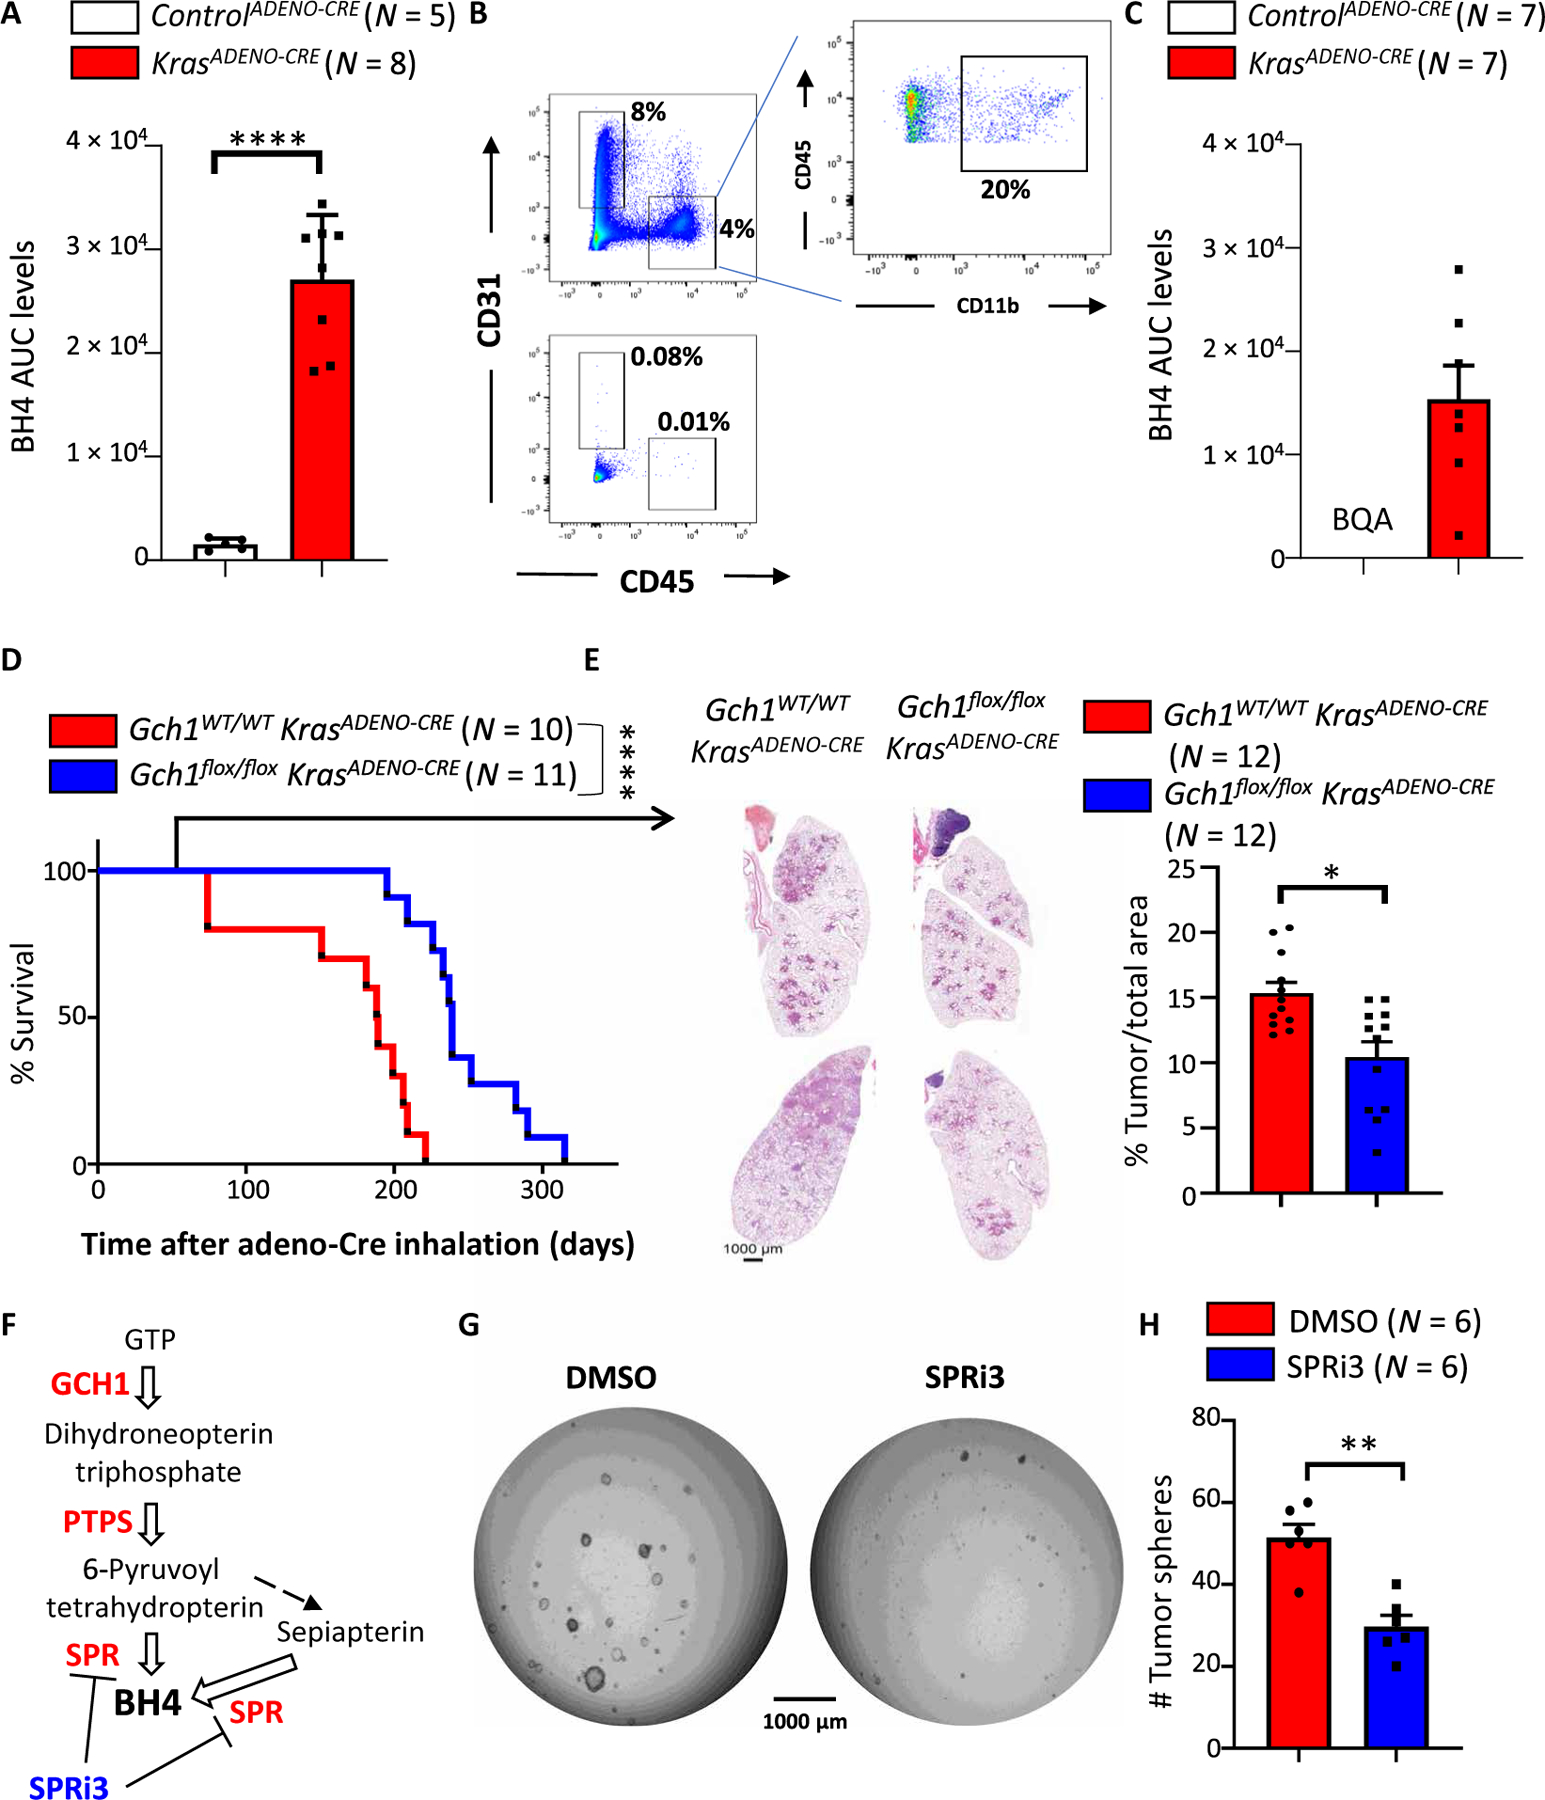
Fig. 5. Active KrasG12D enhances the GCH1/BH4 pathway to drive lung cancer progression.

(A) BH4 measurements in lung tissue of controlADENO-CRE and KrasADENO-CRE mice 5 months after adenovirus (Ad5-CMV-Cre) inhalation. Data are shown as means ± SEM. Individual mice for each genotype are shown. ****P < 0.0001 (Student’s t test). (B and C) FACS analysis of lung tumors before (top) and after (bottom) depletion of immune cells (CD45+CD11b+) and endothelial cells (CD31+) from lung tissue of controlADENO-CRE and KrasADENO-CRE mice 5 months after adenovirus (Ad5-CMV-Cre) inhalation (B). Remaining tumor-enriched cells were subjected to BH4 measurements (C). Data are shown as means ± SEM. Individual mice for each genotype are shown. BQA, below quantifiable amount. (D) Survival curve for Gch1WT/WT KrasADENO-CRE (n = 11) versus Gch1flox/flox KrasADENO-CRE (n = 10) littermates treated with adenovirus (Ad5-CMV-Cre) inhalation. Data are pooled from two independent experiments. ****P < 0.0001 [Log-rank (Mantel-Cox) test]. (E) Representative lung tumor sections (H&E staining) in Gch1WT/WT KrasADENO-CRE and Gch1flox/flox KrasADENO-CRE littermates 12 weeks after Ad5-CMV-Cre inhalation (left) and quantification of overall tumor burden (right). Total tumor areas comprising hyperplasia and adenomas were scored automatically by a Definiens software algorithm and confirmed by a trained pathologist. Data are shown as means ± SEM. Individual lung section samples are shown pooled from three animals from each genotype. *P < 0.05 (Student’s t test). (F) Schematic pathway for BH4 biosynthesis. Enzymes are shown in red, white arrows indicate enzymatic reactions, and black arrow indicates nonenzymatic reaction. The sepiapterin reductase (SPR) inhibitor SPRi3 is shown in blue. (G) Representative images of tumor spheroids derived from purified KrasADENO-CRE primary lung tumor cells treated with vehicle control (DMSO) or the SPR inhibitor SPRi3 (50 μM). Images were acquired 4 days after cells were seeded in Matrigel (5000 primary tumor cells per well). The experiment was repeated with six different mice for each group. (H) Quantification of tumor spheroid numbers described in (G). Data are shown as means ± SEM and pooled from three independent experiments. Individual samples are shown. **P < 0.01 (Student’s t test).
