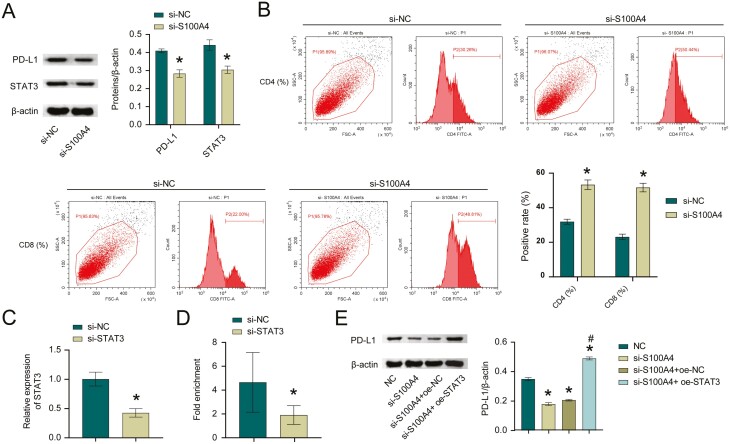
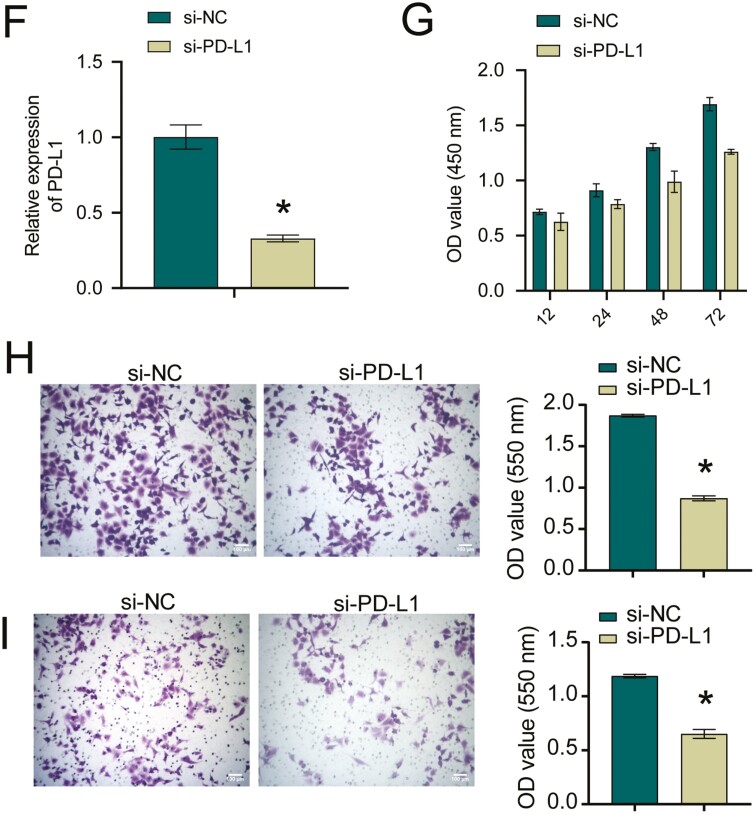
Figure 3:
S100A4 regulated PD-L1 expression and inhibited T-cell immune activity by activating STAT3. A. Western blot measured STAT3 and PD-L1 levels. *P < 0.05. B. The effect of different treatments on CD4+ and CD8+ populations among A549 cells. C. STAT3 knockdown efficiency in A549 cells. *P < 0.05. D. ChIP was utilized to verify STAT3 binding to PD-L1. E. PD-L1 protein level. *P < 0.05 vs NC, #P < 0.05 vs si-S100A4+oe-STAT3. *P < 0.05. F. PD-L1 knockdown efficiency in A549 cells. *P < 0.05. G. CCK-8 assay for si-NC and si-PD-L1 transfected NSCLC cells. H and I. Transwell migration and invasion assays for si-NC and si-PD-L1 transfected NSCLC cells. *P < 0.05.


