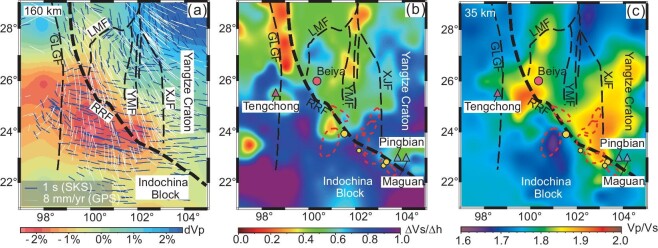
Figure 2.
(a) A depth slice of P-velocity image at 160 km. Bounded at ∼26°N, a major low-velocity anomaly at 160 km depth occurs in the southern part with nearly E-W-trending fast directions in mantle (blue line) by SKS shear wave splitting measurements [28,30,72] and nearly N-S-trending surface displacement vectors (white line) by GPS measurements [26,27]. This image shows the lithosphere decoupling deformation induced by the upwelling asthenosphere. (b) Variation in  near the Moho. The low-resistivity bodies near the Moho [33] are shown for comparison. For explanations see the text. (c) Variation in Vp/Vs ratios near the actual Moho, reflecting main sites for underplating of basic melts at the crust–mantle boundary interface along the Ailaoshan belt. Abbreviations for fault names are the same as those in Fig. 1.

