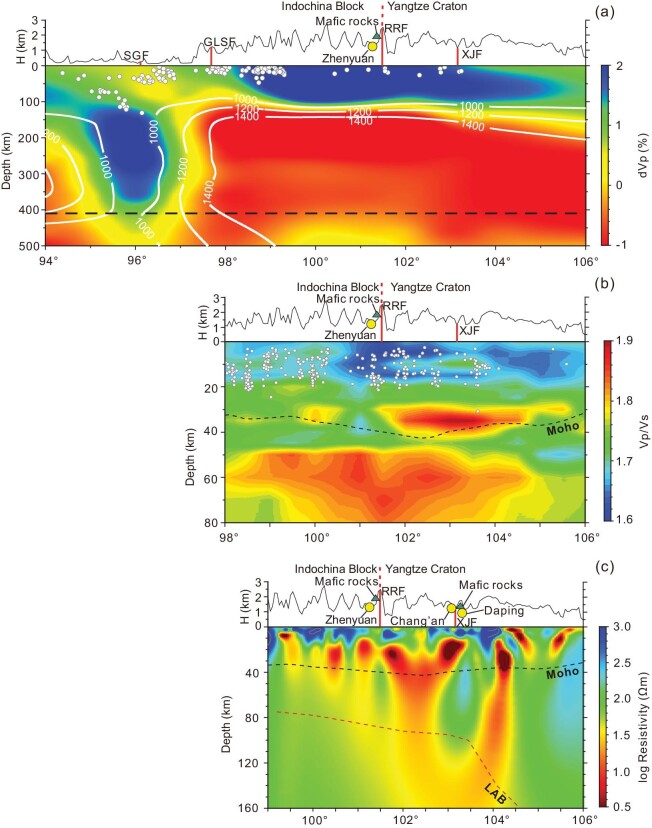
Figure 3.
(a) The Vp structures along a profile at 24°N. The 1000°C, 1200°C and 1400°C adiabats of the upper mantle are estimated based on our determination of seismic velocity using the method from ref. [73]. Geological interpretation is given based on seismic velocity features and other geophysical data (see text). (b) Variation in Vp/Vs along a profile at 24°N. Two major domains of high Vp/Vs occur at the Moho (dashed line) and in the uppermost mantle. (c) MT 3D resistivity model projected on a profile near 24°N. Low‐resistivity anomalies beneath the RRF and XJF trend steeply through the Moho and LAB into the asthenosphere. Abbreviation for faults same as Fig. 1b. Mafic dikes (triangles) and the Zhengyuan gold deposit (circles) are shown in (a–c).

