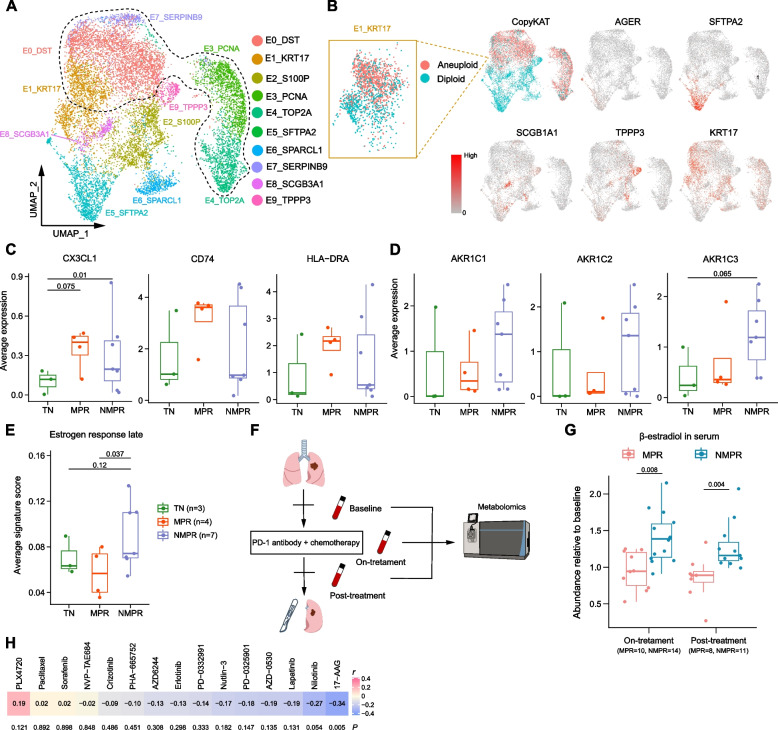
Fig. 2.
Epithelial cell reprograming after therapy. A UMAP plot of epithelia colored by clusters. The cells within the black dash line were malignant cells based on copy number variations (CNVs) inferred by the CopyKAT algorithm. B UMAP plots of epithelia colored by CopyKAT and normal lung epithelial markers. In the left top panel, the cells in red were predicted to be malignant cells and blue were normal cells. The cells in cluster E1_KRT17 contained both malignant and normal cells. C Boxplots of the average expression of CX3CL1, CD74, and HLA-DRA in malignant cells in TN (n = 3), MPR (n = 4), and NMPR (n = 7, one sample with less than 10 malignant cells was removed) patients. Center line indicates the median, lower, and upper hinges represent the 25th and 75th percentiles, respectively, and whiskers denote 1.5× interquartile range. One-sided t-test was used, and the P values were adjusted by the FDR method. D Boxplots of the average expression of ARK1C1-3 in malignant cells in TN (n = 3), MPR (n = 4), and NMPR (n = 7) patients. One-sided t-test was used, and the P values were adjusted by the FDR method. E Boxplot of the average signature score in malignant cells in TN (n = 3), MPR (n = 4), and NMPR (n = 7) patients. One-sided t-test was used. F Longitudinal serums were collected from 24 patients (10 were assessed as MPR, and 14 as NMPR after surgery) at baseline, on-treatment and post-treatment timepoint. Non-targeted Metabolomic was conducted to detect the abundance of β-estradiol. G Boxplots of the β-estradiol abundance relative to baseline in 24 patients (10 patients were assessed as MPR and 14 as NMPR after surgery) at on-treatment and post-treatment timepoint. Two-sided unpaired Wilcoxon test was used. H Correlation analysis between the signature of AKR family genes and IC50 values in NSCLC cell lines under the condition of different drugs. P values were determined by two-sided Pearson correlation test

