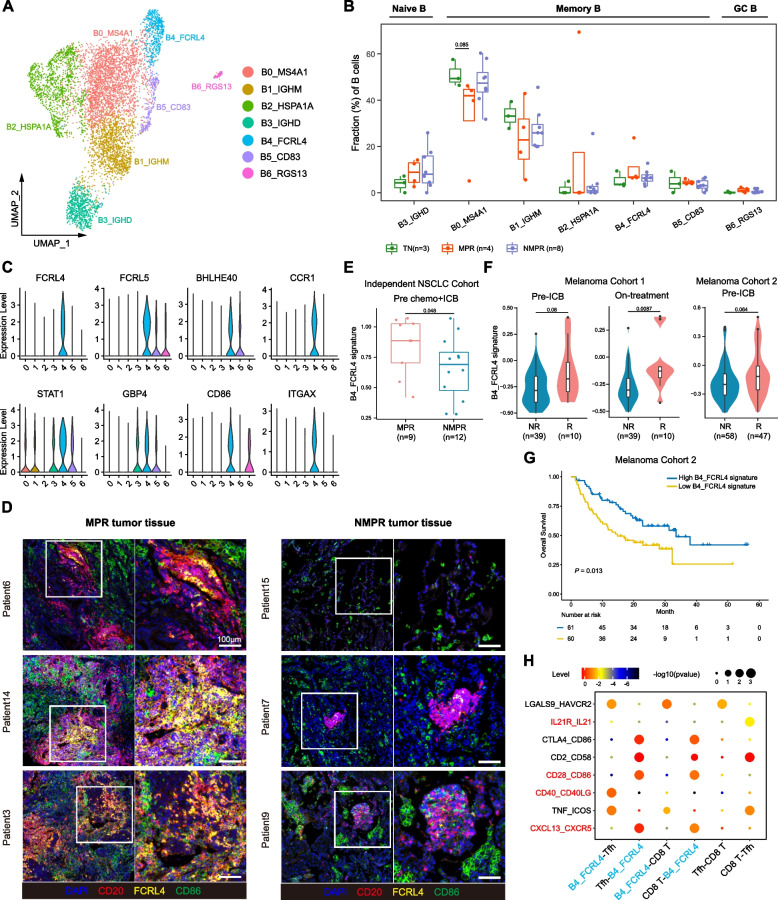
Fig. 4.
B cell remodeling after therapy. A UMAP plot of B cells colored by clusters. B Boxplot showing cellular fractions of each B cluster in TN (n = 3), MPR (n = 4), and NMPR (n = 8) patients. Center line indicates the median, lower, and upper hinges represent the 25th and 75th percentiles, respectively, and whiskers denote 1.5× interquartile range. All differences with adjusted P < 0.10 are indicated. One-sided unpaired Wilcoxon test was used, and the P values were adjusted by the FDR method. C Violin plots of marker genes of B4_FCRL4 cells across clusters. D In situ multiplex immunofluorescence images of B4_FCRL4 cells in MPR and NMPR tumor tissues. E Violin and box plots of B4_FCRL4 signature in our validation cohort (9 patients were assessed as MPR and 12 as NMPR after surgery) before ICB + chemotherapy. One-sided unpaired Wilcoxon test was used. F Violin and box plots of B4_FCRL4 signature in responders (R) and non-responders (NR, removing SD patients) in advanced melanoma cohorts. Two-sided unpaired Wilcoxon test was used. G Kaplan–Meier survival curves of the signature of B4_FCRL4 in advanced melanoma cohort 2. Survival curves were compared by the log-rank test. H Summary of selected ligand-receptor interactions from CellPhoneDB among B4_FCRL4 cells, Tfhs and CD8+ T cells

