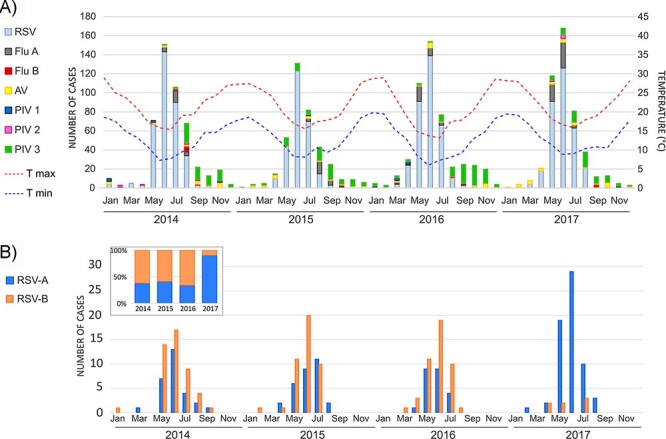
Figure 1.

Seasonality of RSV cases in children hospitalized with lower respiratory tract infection in Buenos Aires between 2014 and 2017. (A) A cumulative bar graph of the number of positive cases of respiratory viruses detected per month per year. Dotted lines represent the minimum and maximum temperatures recorded per month per year published by the Argentine National Weather Service. (B) The seasonality of the RSV-positive cases for subgroups A and B.
