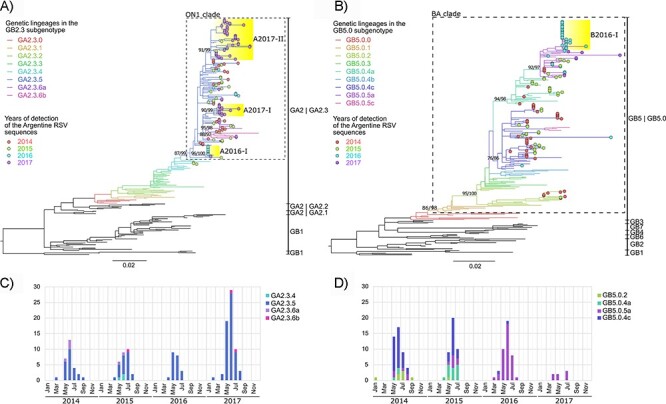
Figure 2.

RSV-A and RSV-B genotyping. Maximum-likelihood trees for RSV genotyping based on the G gene for RSV-A (A) and RSV-B (B). Genotypes and sub-genotypes are detailed at the right of each tree. Color in branches denoted genetic lineages where Argentine sequences were associated. Colored dots at the tips indicate the Argentine sequences per year. Yellow highlight in phylogenetic clades denotes the RSV viral variants (see details in the manuscript). Statistical support (SH-alrt/ultrafast (UF)-Bootstrap) is shown in phylogenetic nodes of ON1 or BA clades, genetic lineages where Argentine sequences are associated, and the viral variants. Bar plots below the phylogenetic trees show the seasonality of the genetic lineages detected in Buenos Aires between 2014 and 2017 for RSV-A (C) and RSV-B (D). The number of cases of each genetic lineage detected per month per year is detailed.
