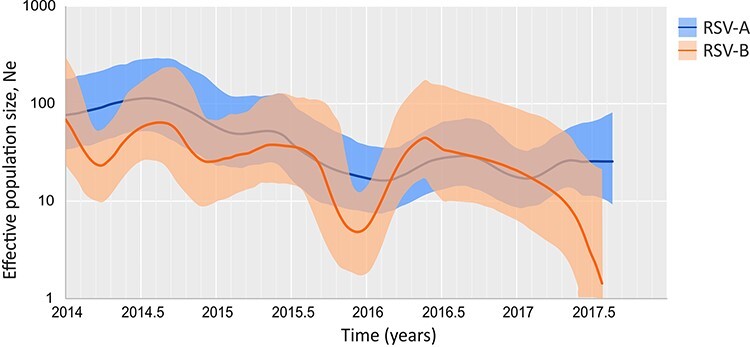
Figure 3.

The phylodynamics of RSV in Buenos Aires between 2014 and 2017. The reconstruction of the effective population size (Ne) concerning the time for RSV circulating in Buenos Aires. The lines show the median value, and the colored areas denote the 95 per cent HPD ranges (light blue: RSV-A and orange: RSV-B).
