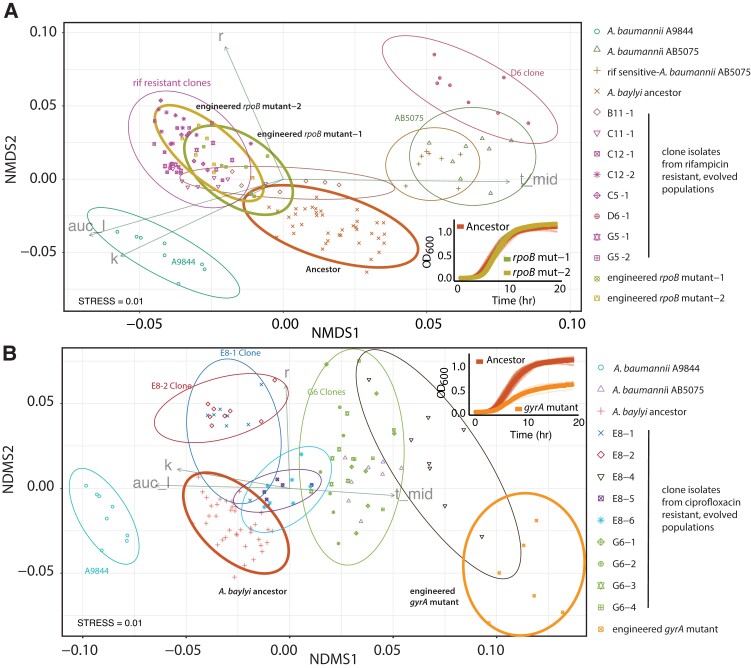
Fig. 3.
We used Growthcurver (Sprouffske and Wagner 2016) to extract values for R, K, t-mid, and area under the curve (AUC). The growth performance of all strains was compared on two dimensions, using non-metric dimensional scaling. Vectors for R, K, and AUC indicate an increase in growth according to these measures. The increase along the t-mid vector indicates a longer lag time and decreased growth. (A) Clones from populations that were able to survive rifampicin treatment were compared with ancestors, donors, and two reconstructed rifampicin-resistant clones. Two reconstructed clones (bold brown and green ellipses) were not different from the ADP1 ancestor (red ellipse). (B) The reconstructed ciprofloxacin mutant (orange ellipse) had a longer lag time and reduced carrying capacity compared with the ADP1 ancestor (red ellipse). Each shape depicts an experimental replicate, ellipses show 95% confidence intervals, and ellipses that overlap are not significantly different. Alphanumeric codes refer to well positions that correspond to each treatment (fig. 1A). For example, G5-1 and G5-2 correspond to two separate clone isolates from the same population, G5, which is from the HGT AB5075 treatment. Growth curves corresponding to the comparisons shown with bold ellipses are shown inset for panels A (bottom right) and B (top right).

