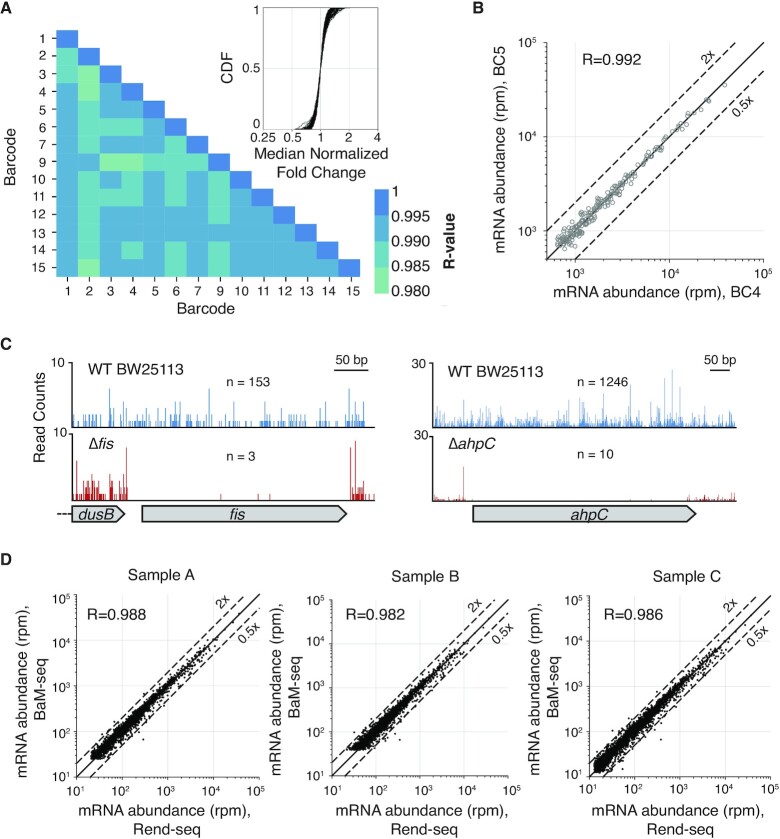
Figure 2.
Validation of BaM-seq protocol. (A) Pearson correlation of log10-transformed rpm values for genes with at least 100 mapped reads (212 genes) between 14 technical replicates. Minimum R-value = 0.983. The inset shows the cumulative distribution of median-normalized fold-changes for all pairs of genes between all pairwise combinations of replicate samples. (B) Representative example of rpm correlation between two replicates as in (A). Genes with more than 100 mapped reads in both samples are plotted. (C) 5’ mapped reads across fis and ahpC genomic loci in WT (153 and 1246 mapped reads, respectively), and Δfis (three mapped reads) and ΔahpC (10 mapped reads) E. coli strains. (D) Relative expression of genes as measured from three split RNA samples processed with BaM-seq or Rend-seq. Rpm was plotted for all genes with >100 reads in both samples.

