Figure 2.
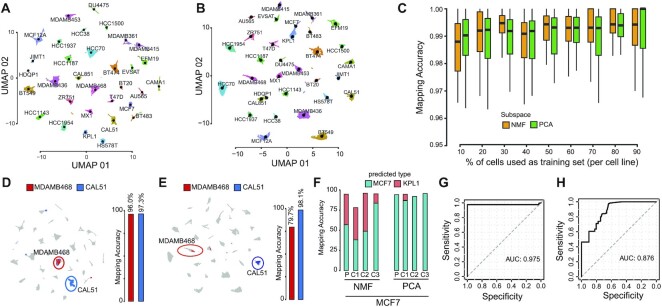
Single-cell mapping accuracy evaluation. (A) UMAP representation of 35 276 cells from 32 breast cancer cell-lines using as cell subspace NMF. Cells are color-coded according to their cell-line of origin. Single-cell transcriptional profiles were normalized with gficf package. (B) Same as (A) but using PC as cell sub-space (C) Accuracy evaluation of mapping method using cross-validation approach using as cell sub-space either NMF (orange) or PCA (green). Each boxplot display accuracy distribution in classifying the 32 cell lines but using as a training set the percentage of cells indicated on the x-axis. Accuracy is defined as the number of correctly classified cells over the total number of mapped cells. (D) Left plot; mapping of the MDAMB468 and CAL51 cells after they were re-sequenced with drop-SEQ technology. Right plot; accuracy of the mapping method in classifying re-sequenced MDAMB468 and CAL51 cells. NMF cell subspace is used. (E) Same as (D) but using PC sub-space. (F) Accuracy evaluation of the mapping method on 14 372 single-cell transcriptomes sequenced with 10x Chromium method for MCF7 parental (P) cell line and three derived subclones (C1,C2,C3) using as cell sub-space either NMF (left) or PCA (right). (G) Performance of the mapping method in classifying 2311 single-cell transcriptomes sequenced using the 10x Chromium method from eleven distinct breast cell lines cell. Performances are reported in terms ROC curve and AUC is also displayed. (H) Same as (G) but using PC cell sub-space.

