
Figure 1.
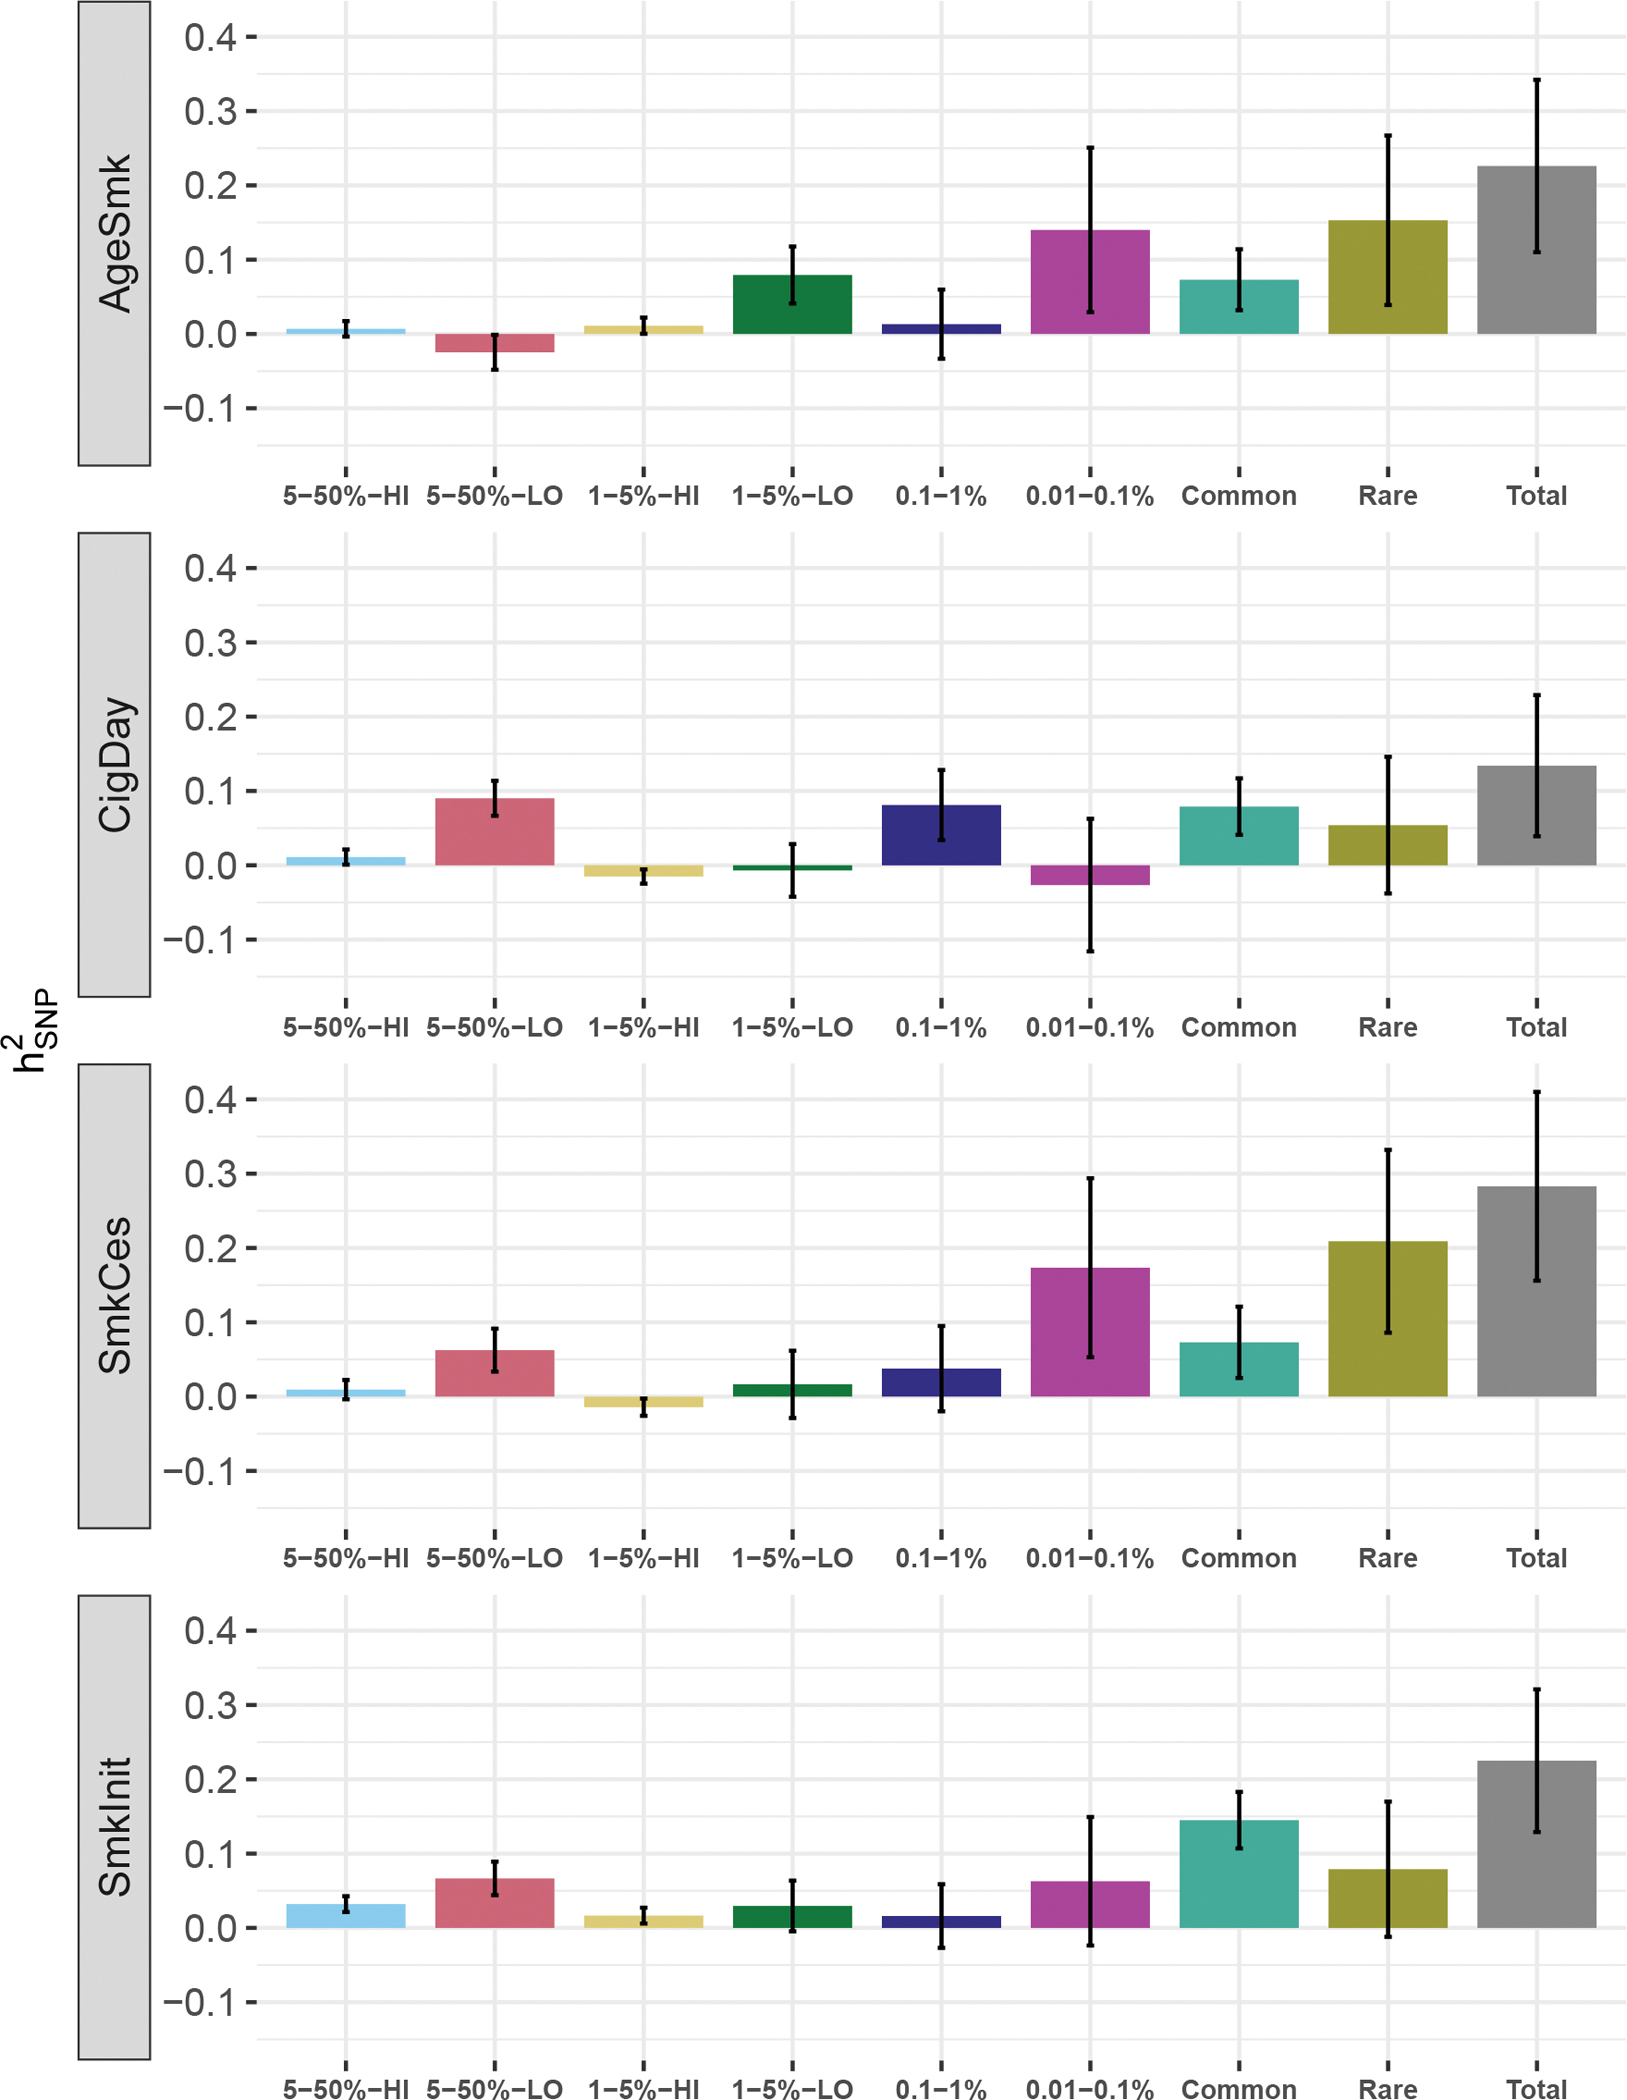
SNP-based heritability estimates in the European ancestry sample for each of the six MAF/LD bins, and sums across bins.
Error bars represent standard errors. The “Rare” bin is the sum of the MAF 0.1–1% and MAF 0.01–0.1%. “Common” is the sum of the other MAF bins. “Total” is the sum of “Rare” and “Common”. HI and LO each indicate high and low LD. All estimates were adjusted for by demographic variables and 20 PCs (half of them from rare variants) as fixed effects along with random effect of cohort except for CigDay which was adjusted for 5 common PCs to allow model convergence.