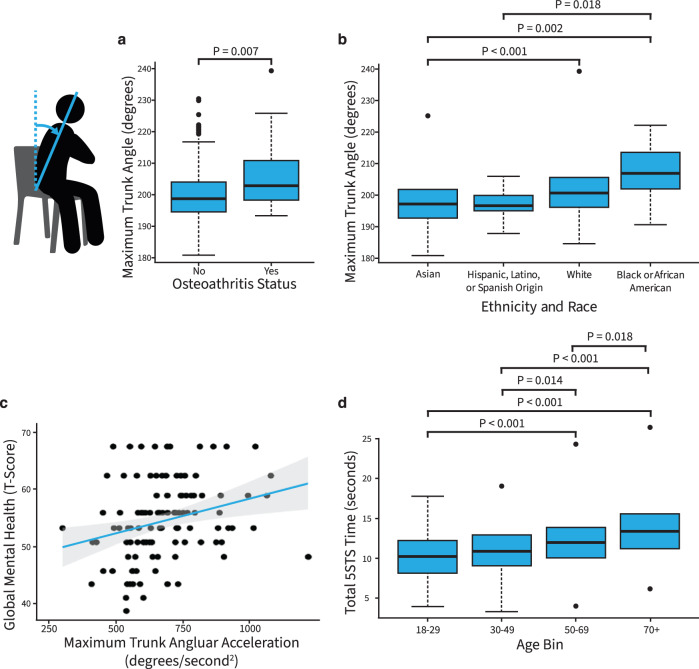
Fig. 2. Relationships between sit-to-stand parameters and survey measures.
a Trunk angle is larger in patients with hip or knee osteoarthritis, determined from a Pearson correlation test adjusted to control for the false discovery rate. b Trunk angle differs across race and ethnicity, determined from a Dunn’s test with multiple comparison p values adjusted to control for the false discovery rate. c Greater trunk angular acceleration is associated with a higher mental health score, determined from a Pearson correlation adjusted to control for the false discovery rate with all 21 comparisons. d Test completion times increase with older age, as determined by a t-test. In the box-and-whisker plots, the top and bottom lines of the boxes (hinges) are the first and third quartiles, respectively. The horizontal line is the median, and the whiskers extend from each hinge to the largest value no further than 1.5 times the interquartile range to the respective hinge. In the scatter plot, the gray shading around the blue regression line represents the confidence interval in the scatter plot.

