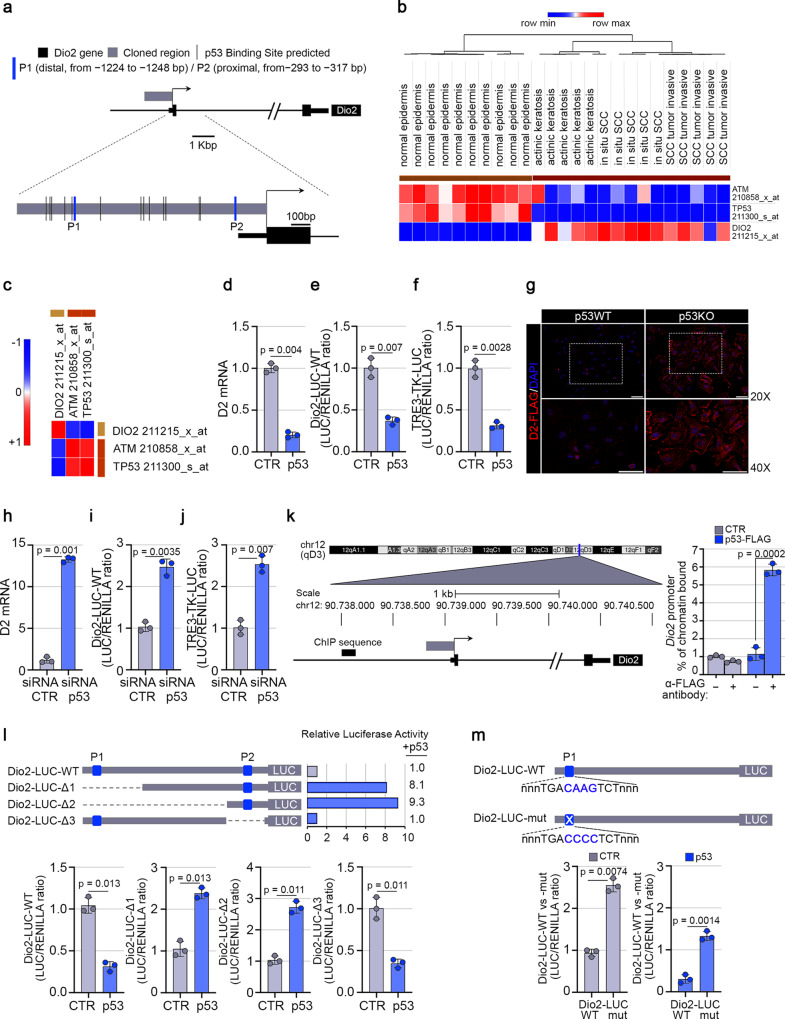
Fig. 1. p53 downregulates the Type 2 Deiodinase transcription in SCC cancer cells.
a Schematic localization of 15 different putative p53 consensus motifs within the Dio2 promoter region. Blue bars indicate the distal (P1: − 1224 to −1248 bp) and the proximal (P2: − 293 to −317 bp, score 0.944) p53 consensus motifs. b Expression heatmap of ATM, TP53, and DIO2 genes, differentially expressed across normal epidermis, actinic keratosis, in situ, and invasive SCC samples from GSE42677. c Pearson’s correlation analysis was performed for the same dataset samples as in (b), by using Morpheus heatmap visualization software (Pearson’s correlation coefficient, ρ: ρATM = 0.86; ρTP53 = 0.95; ρDIO2 = −0.93). d D2 mRNA expression was measured by Real-Time PCR in SCC011 cells transiently transfected with a p53-expressing vector or a control empty plasmid (CTR) (n = 3 independent experiments). e, f Transient co-transfection of a Dio2-LUC-WT promoter (e) and an artificial T3-responsive promoter, TRE3-TK-LUC (f), with a p53-expressing vector or a CTR plasmid, in SCC011 cells (n = 3 independent experiments). g D2-FLAG expression levels were measured by immunofluorescence (IF) analysis of mouse primary keratinocytes from D2-Flag/p53 null mice and D2-Flag/p53 wild-type mice transfected with the p53 or the CTR plasmid (representative of 3 images per sample, n = 3 mice). Data are presented as overviews (top rows) and higher magnification (bottom rows). Magnification 20X and 40X. Scale bars represent 50 μm. h D2 mRNA expression was measured by Real-Time PCR in SCC011 cells transiently transfected with a cocktail of siRNAs used against the endogenous p53 messenger (n = 3 independent experiments). i, j Transient co-transfection of a cocktail of siRNAs used against the endogenous p53 messenger along with the Dio2-LUC-WT promoter (i) and the TRE3-TK-LUC promoter (j), in SCC011 cells (n = 3 independent experiments). k Chromatin Immuno-Precipitation (ChIP) assay was performed in SCC011 cells transiently transfected with a p53-FLAG expressing vector, followed by Real-Time PCR with primers specific for DIO2 promoter region proximal to TSS. Graph shows the Real-Time PCR results with % chromatin bound (n = 3 independent experiments). l Schematic representation of the Dio2-LUC deletion mutants (Dio2-LUC-Δ1, Δ2, and Δ3) for the analysis of the selective disruption of the P1 or the P2 p53 binding sites within the Dio2 promoter region (n = 3 independent experiments). m Schematic representation of the point mutation of the P1 p53 binding site for the generation of the Dio2-LUC-mut promoter and evaluation of the Dio2 mutant promoter activity versus Dio2 wild-type promoter activity in SCC011 cells (n = 3 independent experiments). All the results in (d–f); (h–m) are shown as means ± SD from at least 3 separate experiments. p-values were determined by two-tailed Student’s t-test. *p < 0.05, **p < 0.01, ***p < 0.001. Source data are provided as a Source data file.

