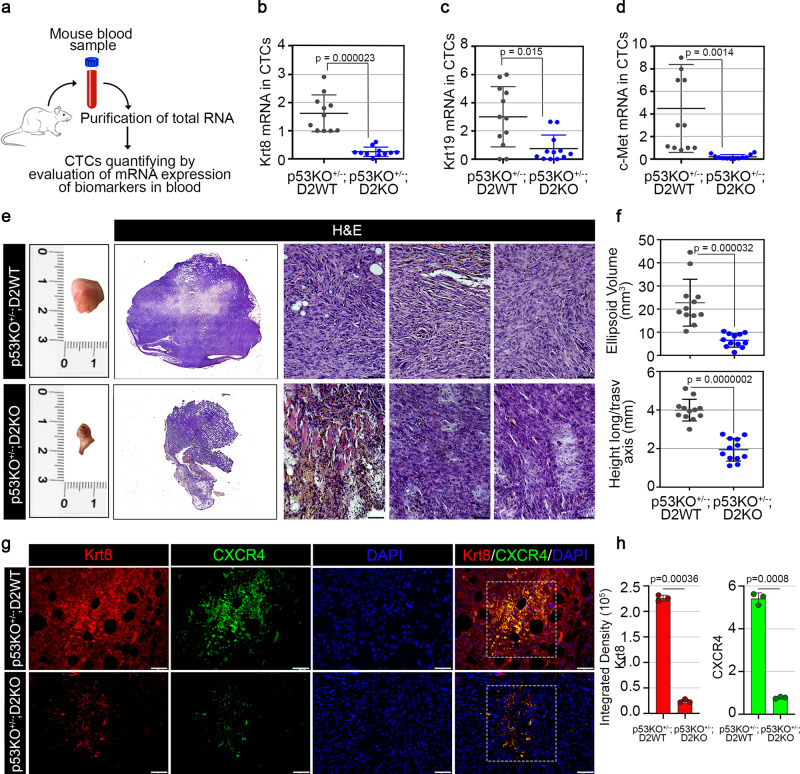
Fig. 4. Loss of D2 attenuates the p53-dependent tumor metastatization at distant sites.
a Graphical representation of the strategy used to isolate circulating tumor cells (CTCs) from mouse blood samples of DMBA-treated (i) p53KO+/−;D2WT and (ii) p53KO+/−;D2KO mice (n = 12 mice/group). b–d mRNA expression of three metastatic biomarkers, Krt8 (b), Krt19 (c), and c-Met (d), was measured by Real-Time PCR in CTCs isolated from blood samples of DMBA-treated (i) p53KO+/−;D2WT and (ii) p53KO+/−;D2KO mice (n = 12 mice/group). e Representative images of inguinal lymph nodes from (i) p53KO+/−;D2WT and (ii) p53KO+/−;D2KO mice treated with DMBA for 8 weeks and harvested at 20 weeks after Dio2 genetic depletion and DMBA administration (n = 12 mice/group). H&E of a representative inguinal lymph node for each group of mice (representative of 3 images per sample, n = 3 mice). Full lymph node-section reconstruction with Leica LAS X Navigator and representative zoom images. Magnification 20X. Scale bars represent 50 μm. f Ellipsoid volume (mm3) and height longitudinal/transversal axis (mm) of solid lymph nodes derived from (i) p53KO+/−;D2WT and (ii) p53KO+/−;D2KO mouse models (n = 12 mice/group). g IF staining with Krt8 and CXCR4 markers of lymph nodes sections from (i) p53KO+/−;D2WT and (ii) p53KO+/−;D2KO mice. Magnification 20X. Scale bars represent 50 μm. h Relative quantification of Krt8 and CXCR4 immunofluorescent signals (Integrated Density) are represented by histograms (representative of 3 images per sample, n = 3 mice). All the results are shown as means ± SD from at least 3 separate experiments. p-values were determined by two-tailed Student’s t-test. *p < 0.05, **p < 0.01, ***p < 0.001. Source data are provided as a Source data file.

