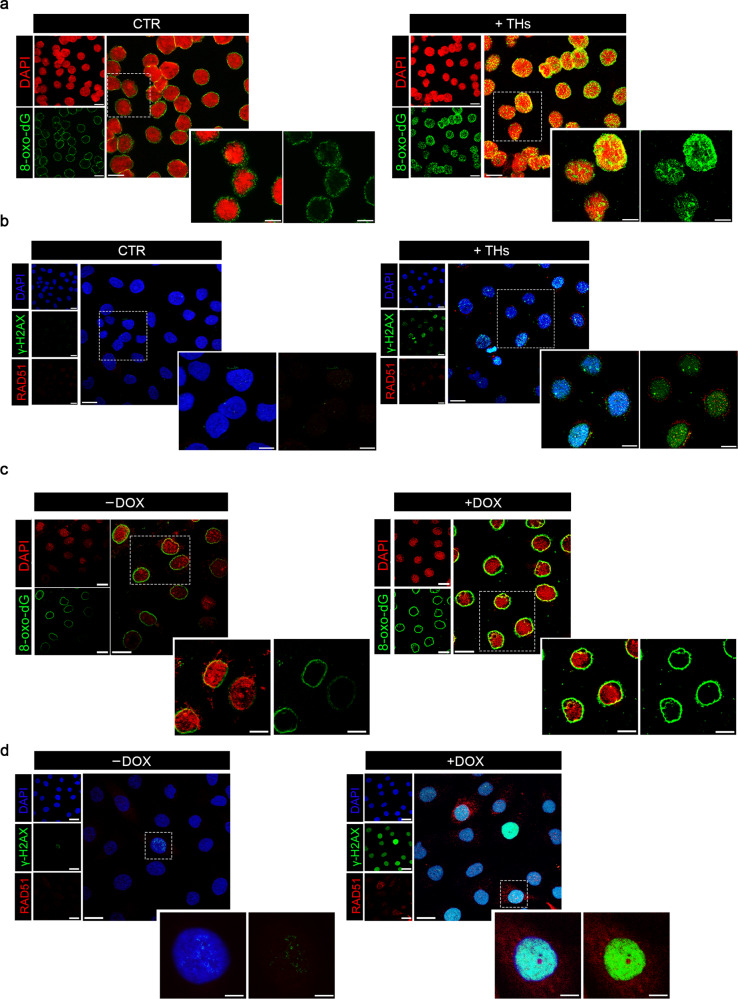
Fig. 6. THs induce DNA damage and unbalanced DNA damage response.
a Confocal images of 8-oxo-dG IF staining in SCC011 cells treated or not with THs (T3, 30.0 nM + T4, 30.0 nM) for 24 h. Data are presented as overviews (top rows) and higher magnification (bottom rows) (representative of 3 images per sample). Magnification 40X. Scale bars represent 20 μm. b Confocal images of γ-H2AX and RAD51 IF staining in SCC011 cells treated or not with THs (T3, 30.0 nM + T4, 30.0 nM) for 24 h. Data are presented as overviews (top rows) and higher magnification (bottom rows) (representative of 3 images per sample). Magnification 40X. Scale bars represent 20 μm. c Confocal images of 8-oxo-dG IF staining in SCC13 Tet-ON-D2 cells treated or not with doxycycline (DOX, 2 μg/mL) for 24 h. Data are presented as overviews (top rows) and higher magnification (bottom rows) (representative of 3 images per sample). Magnification 40X. Scale bars represent 20 μm. d Confocal images of γ-H2AX and RAD51 IF staining in SCC13 Tet-ON-D2 cells treated or not with doxycycline (DOX, 2 μg/mL) for 24 h. Data are presented as overviews (top rows) and higher magnification (bottom rows) (representative of 3 images per sample). Magnification 40X. Scale bars represent 20 μm.

