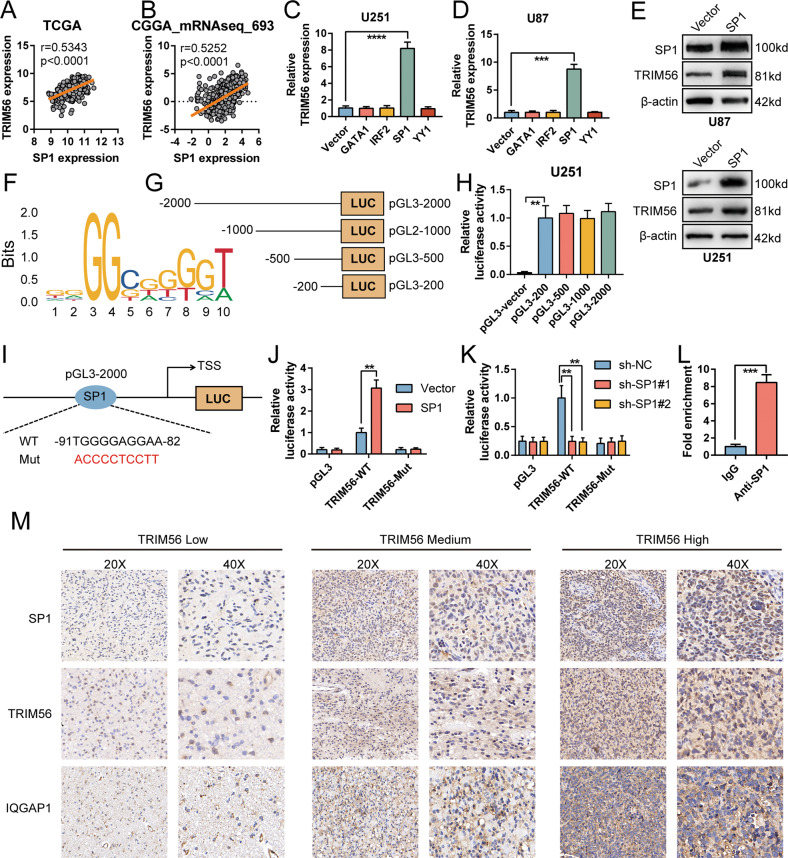
Fig. 2. SP1 induced TRIM56 expression.
Correlation between SP1 and TRIM56 expression levels in The Cancer Genome Atlas (TCGA) (A) and CGGA_mRNAseq_693 (B) cohorts. Relative TRIM56 mRNA expression levels following GATA1, IRF2, SP1, and YY1 overexpression in U251 (C) and U87 (D) cells. E SP1 overexpression in U87 and U251 cells upregulated TRIM56 expression. F The sequence motif of TRIM56 promoter for SP1 binding, analyzed via JASPAR. G Four truncations of the TRIM56 promoter were integrated into pGL3 plasmids. H Relative promoter activity of truncations in U251 cells. I Schematic depiction of wild type and mutant SP1 binding sites in the TRIM56 promoter. J Relative activity of the mutant TRIM56 promoter in SP1-overexpressing U251 cells. K Relative activity of the mutant TRIM56 promoter in SP1-knockdown U87 cells. L ChIP-qPCR analysis of SP1 bound on the promoter of TRIM56 in U251 cells. M Representative immunohistochemical staining displaying the relationship between TRIM56 expression and SP1, IQGAP1 expression in glioma samples, respectively.

