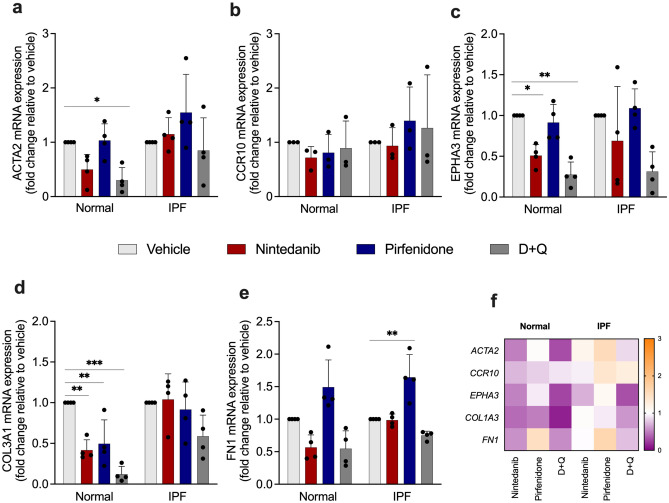
Figure 4.
Effects of SOC drugs and D + Q on ACTA2, CCR10, EPHA3, COL3A1, and FN1 mRNA expression in normal and IPF senescent lung fibroblasts. Heatmap of the expression of SASP and fibrosis-related genes in lung fibroblasts from normal and IPF patients treated with nintedanib (300 nM), pirfenidone (2.5 mM), D + Q (20 μM/15 μM) for 24 h. ACTA2 (a), CCR10 (b), EPHA3 (c), COL3A1 (d) and FN1 (e) transcripts were first normalized to the housekeeping gene 18S Each transcript was first normalized to the housekeeping gene RNA 18S. Upregulation (orange) and downregulation (purple) of gene expression, compared with vehicle-treated cells (f). Data are presented as mean ± SD (n = 3 or 4 per group). p values were calculated using one-way ANOVA followed by Tukey’s test. *p < 0.05; **p < 0.001; and ***p < 0.0001 as indicated by the bars.

