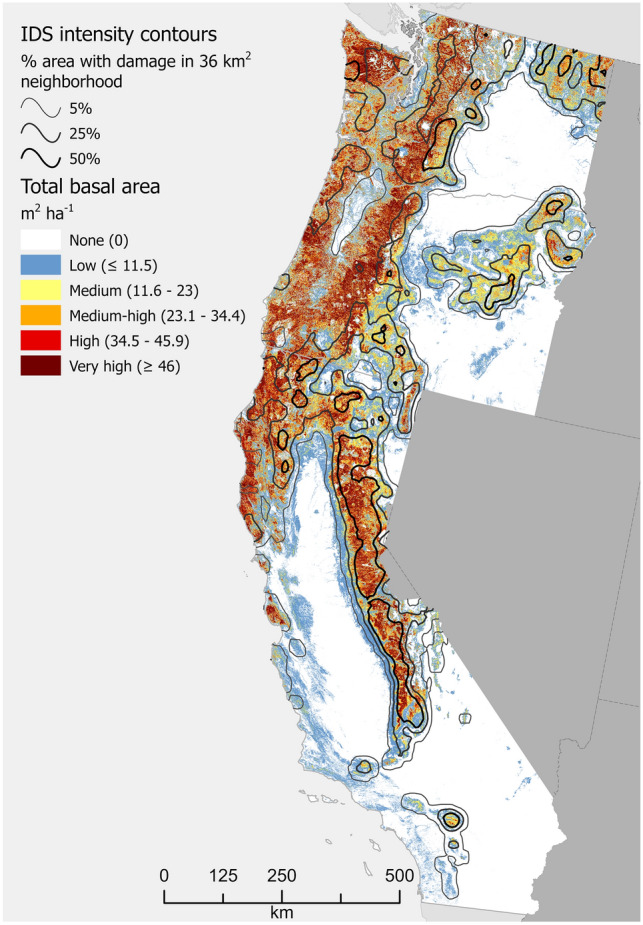
Figure 4.

Total basal area (TBA), m2 ha−1, of forestland across the West Coast region of the conterminous USA. Values represent averages across 240-m resolution map cells. Many cells contain areas of non-forest, which causes their values to be lower than TBA values typical of the constituent forest stands. Cells with a complete lack of tree cover are shown in white. Contour intervals depict relative concentrations of forest damage (defoliation or mortality) as recorded in Insect and Disease Survey (IDS) data. For example, the 50% contour line defines places where at least half of the area within a 36 km2 neighborhood experienced damage at least once during the analytical period, 2000–2019. See “Methods” for analytical details. Map created using Esri ArcGIS Pro 2.9.5, https://www.esri.com/en-us/arcgis/products/arcgis-pro/overview.
